Six months have passed since the largest quarter in the UK’s solar history, and DECC has just about got there with regards to sizing the market in Q1’15 (January to March 2015).
The lag has been known for ages. The question is why lots of people still take government stats as the gospel for solar installation figures. The UK is not the only one here. There are many global market firms that swear by government data as being the only correct and official source to use – one wonders often what world these people live in.
The reason why Q1’15 is so important to get right is that it was a 2.5GW market for solar in the UK – and this dwarfs almost every other country globally at the start of the year, not to mention anything the UK had done before. And given the RO changes being proposed by DECC – largely due to greater than expected UK solar deployment – there are many in the UK that simply expected better from the government and the companies they paid to gather their data for them.
But DECC was not the only organisation to get Q1’15 wrong by a long way. Various global firms looking at the UK market (albeit those located around the world and not that well connected with the UK solar industry) sized Q1 between 1GW and 1.6GW. At the same time – end April 2015 – DECC was at 614MW for its Q1’15 sizing. Most suppliers of solar to the UK knew these guesses were way off the mark.
When Solar Media added up all the installations, we got to 2.53GW. We felt this number was very good as we had counted the projects bottom up for the utility activity, and then pursued EPCs and suppliers to cross-check.
Sizing Q1’15 so soon at 2.53GW – and way above any other estimate – was met with disapproval from many within the UK solar industry however, who simply did not believe the UK could have done so much in Q1’15, and we must have got it wrong. We were accused of being sensational and potentially causing alarm bells at DECC.
Some six months on, let’s put some perspective on this, with data to back this up for once and for all.
Yesterday DECC came out with another upgrade – the fifth upward figure in five months – and are now sizing Q1’15 at 2.45GW; so now just within 3% of our bottom-up number reported ages ago.
Here is how DECC’s Q1 number has crept up. You can see clearly how the final Q1’15 market figure is starting to plateau almost exactly at the figure we put on the market after the quarter closed.
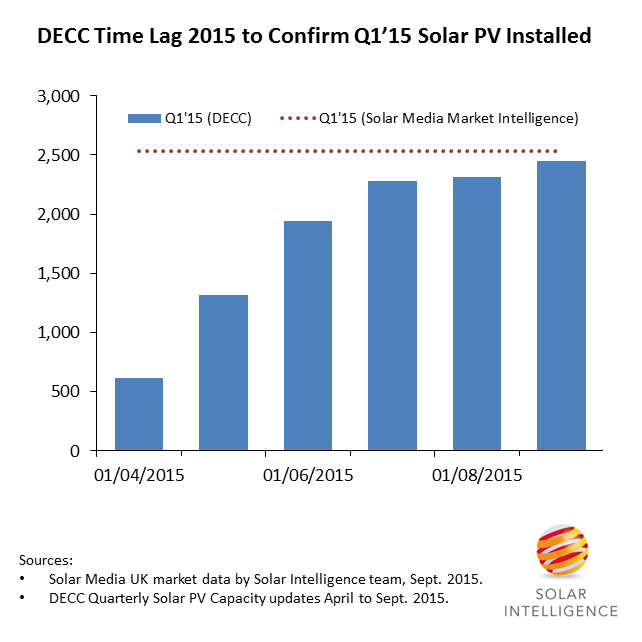
Figure 1: DECC’s attempts to size the UK market for Q1’15 deployment have taken over six months to reach the figure that Solar Media put on Q1’15, after the quarter closed.
And here are the figures from DECC’s release yesterday – subtract the end-December 2014 number from the end-March 2015 number, and you get the 2.45GW DECC is now saying was deployed in the UK during Q1’15.
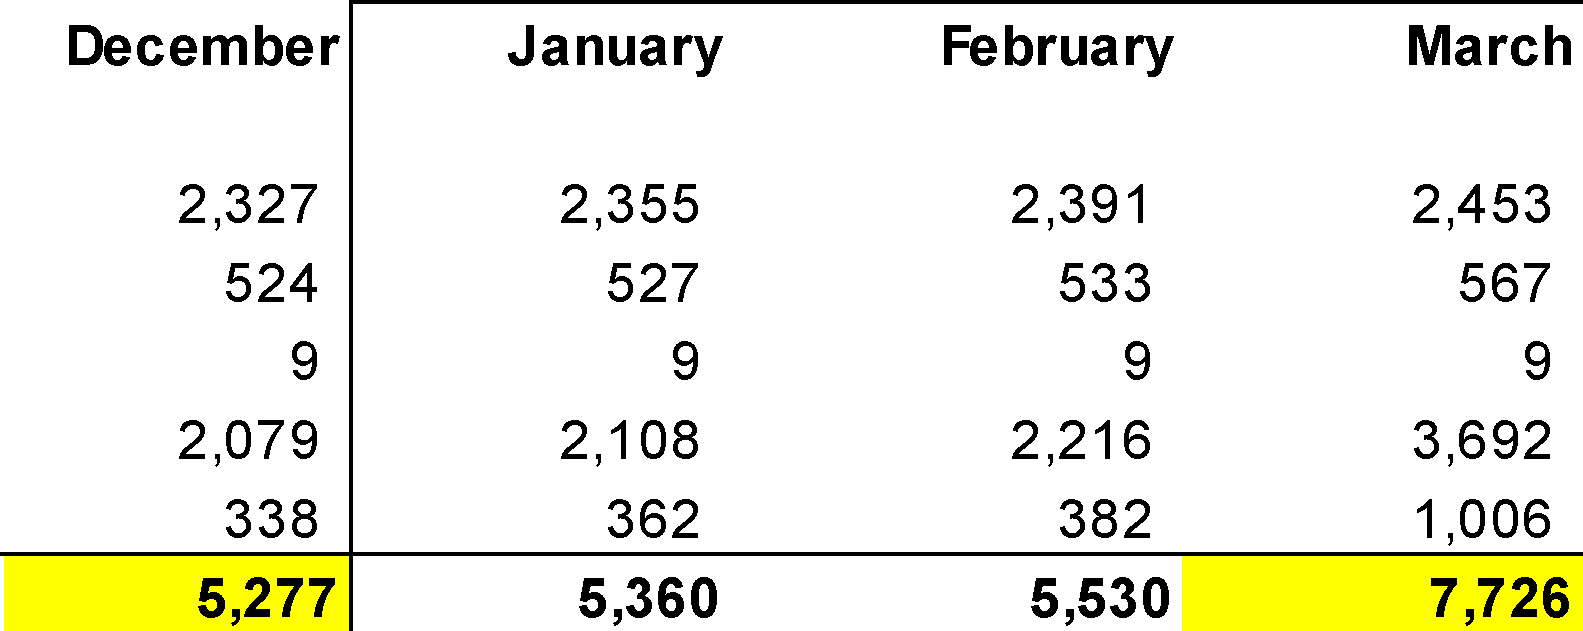
Figure 2: DECC is sizing the UK’s Q1’15 solar deployed at 2.45GW now, having initially put the figure at just 614MW at the end of April 2015.
After we came out with our 2.53GW figure for Q1’15, most others revised up their estimates to the 2GW to 2.5GW range, and indeed, many are still putting up figures every quarter.
As a reference point of where the UK is at the end of Q2’15, here is the latest data from Solar Media:
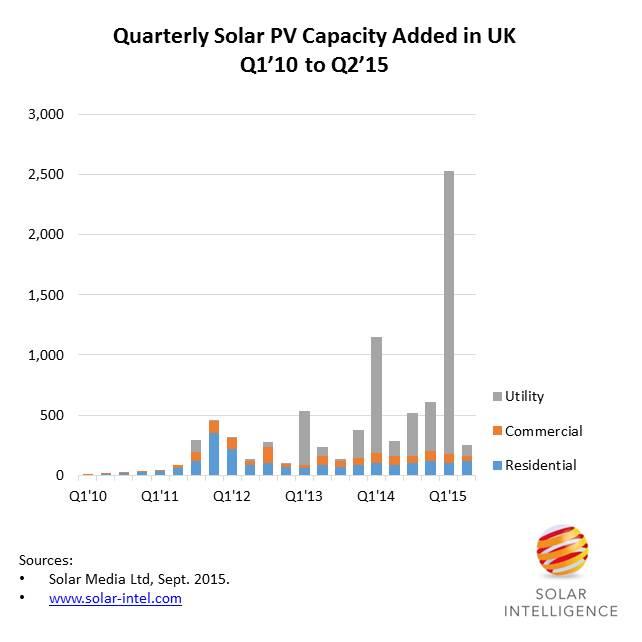
Figure 3: Segmentation of the UK solar industry, showing quarterly deployment segmented by residential, commercial and utility. Source: Solar Media Ltd, Sept. 2015.
As the ghost of Q1 market sizing continues to hang over DECC – as it did for much of 2014 after the GW+ deployed in Q1’14 – one wonders now what lies ahead for Q1’16. The only difference this time may be: whatever is deployed – there may simply be nothing left for DECC to cut back on 1 April 2016 if the multiple body blows of the past few months end up being nothing other than a done-deal or fait accompli to which no amount of industry lobbying can ultimately change.