
Recently, we were the first to report on the size of the UK solar market during Q1 2016, at 1.553GW. Full details of this can be found here.
Last year, when the UK had its largest ever quarterly deployment of 2.53GW in Q1 2015, we also reported on this exclusively, and then waited for the rest of the industry – including the government registers and other market research firms – to adjust their previous estimates to be fully aligned with our market sizing methodology. Details on the article we wrote 12 months ago on this can be located here.
While we sat back and watched many observers of the UK industry (most located outside the UK and unaware that government statistics are not up to date) regurgitate the government’s figures for Q1 2015 every month, we decided to perform a tracking analysis of how accurate the government’s figures were.
Here is an updated graphic on Q1 2015. The dashed line is the sizing of our research team back in June last year. The bars show the gradual upward revision in government estimates for Q1 2015 over the 12 month period after the quarter finished on 31 March 2015.
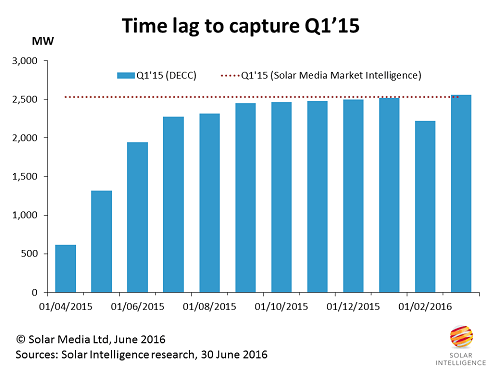
The accuracy of our Q1 2015 market sizing, performed just weeks after the quarter closed, currently stands at better than 99%. Government data was 25% accurate at the end of April 2015, and it took six months for the government registers to get above 95% in accuracy. The dip in the government data in February 2016 (sizing Q1 2015) is likely related to a change in the way the government data was accumulated overlapping with a methodology change done then. Either way, the March 2016 figure for Q1 2015 was reset at the correct value.
Now the focus turns to sizing Q1 2016. As noted above, we size this bottom-up at 1.553GW using our in-house methodology. We will see in the course of time how this stacks up with government data, but there are some differences this year in counting that could mean we have a much longer wait on our hands.
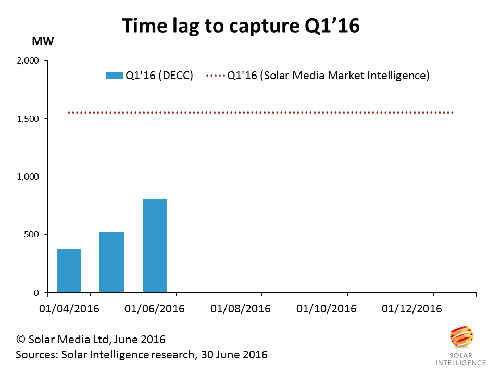
At the end of April 2016, Ofgem was sizing Q1 2016 (in its monthly stats update for DECC) at just 370MW, interestingly again logging just 25% of deployment at the end of the first month after the quarter had closed. This figure increased to 520MW at the end of May 2016, and earlier today, it was revised again to 808 MW.
Here is our Q1 2016 tracking graphic, similar to above, where we will be observing over the coming months how quickly the government’s data reaches the 1.5GW point.
It is likely that the government data this time around may take longer than six months to come close to our 1.553GW figure. This is due to several reasons, not in play during Q1 2015.
Many sites done in Q1 2016 were part of larger sites at 4.99MW, most often under FiTs, and where the same location may have a second community FiT site added later. Also, many sites were done on FiTs, not ROCs, and most were pre-accredited in the second half of 2015. These sites would typically get captured in the ROO-FiT numbers, a category that is notorious for being significantly time-lagged, and more so even the ROCs getting captured.
We will provide more updates later in the year, as we gather more data from various sources. However, very quickly, attention will turn to what was deployed in Q2 2016. We will outline activity in the most recent quarter during August.