With the UK likely to see a pause on build out of the GW-plus of new post-subsidy large-scale solar farms previously forecast for 2020, the in-house market research team at Solar Media has been updating its analysis of completed solar farms in the UK as of end 2019.
The output from this analysis will be featured extensively on Solar Power Portal over the coming weeks. This is the first part of the series of articles, where various aspects of the UK’s 8.5GW of solar farms are dissected, presented visually across graphics, and explained fully.
All data and analysis is taken from the UK Ground-Mount Solar Completed Assets Report, released every month by our research team, containing full audit trails for all ground-mounted solar farms in the UK through to current asset owners.
The first part of the completed-assets article series here looks at annual deployment trends by subsidy mechanism and the regional location of built projects.
The unwanted bell curve of UK solar’s roller-coaster past life
Until 2010, the UK did not have any large-scale solar farms. This is true, even with the definition of ‘large-scale’ being >250kW in size. Before then, the UK’s solar industry could count installations of more than 50kW on one hand, and those were all on top of roofs or mounted on the side of buildings.
Everything changed, however when FiTs and RoCs were on offer, as seen clearly in the figure below.
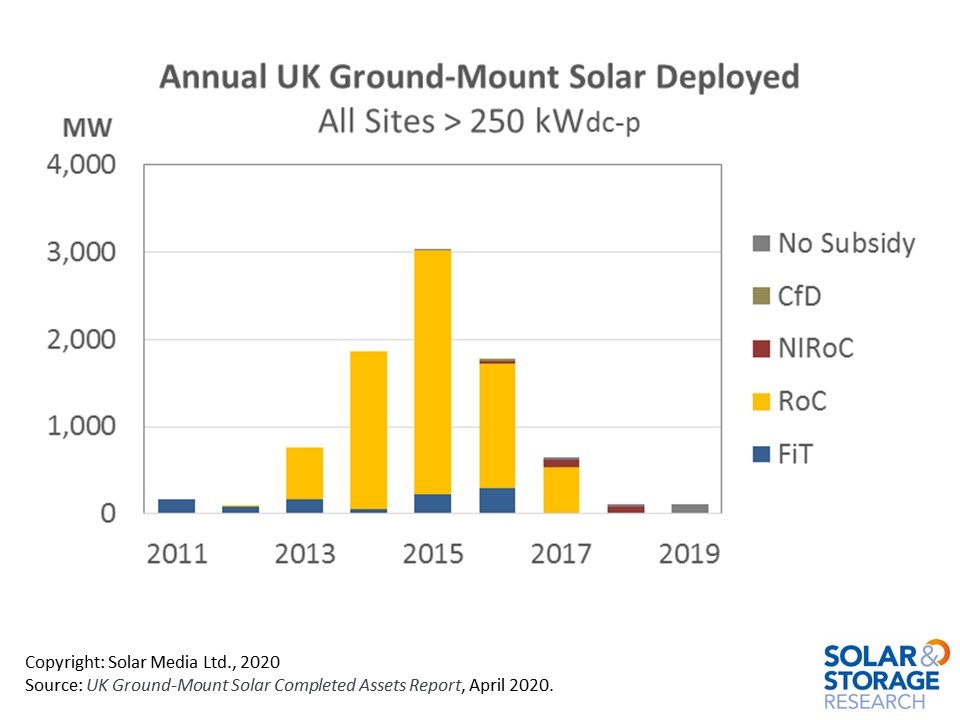
The UK solar industry’s boom years from 2013 to 2017 were dominated by projects that were successfully accredited under the Renewable Obligations Certificates (RoC) scheme.
First, to make sure all definitions are fully understood. The years shown are calendar years, not UK fiscal years. All completed projects are based on ground-mount sites with an installed capacity above 250kW (p-dc). The very few projects of this size based on car-ports and floating solar are included in this definition: essentially, everything above the 250kW level that is not attached to a building in the form of rooftop or any BIPV-type arrangement.
In reality, the UK’s 8.5GW of completed ground-mount assets is dominated by large-scale solar farms in the 5-50MW range. Therefore, the definitions are somewhat mute, as the contribution of the niche segments is in the noise.
While there was some initial activity in the UK back in 2011, where large-scale FiTs existed for a short period (sub 5MW), and CfDs garnered press coverage way beyond their station, the UK’s solar boom period was all about ROCs. It is that simple. While they existed, life was great for solar farm stakeholders: when they were no longer available, business ground to a complete halt for many that were formerly dependent on this one type of revenue stream.
Of course, the key narrative to be looking at in the solar industry from the middle of 2017 has been new project planning, revealed in the current pipeline that is above 7GW today. If you have not yet come to grips with this, then go straight from reading this article to the one I wrote on Solar Power Portal last week, available here.
The figure above also shows that the UK industry – at the end of 2019 – had definitely not moved into the post-subsidy (zero-subsidy) mode. The country is still waiting for its first real post-subsidy project. Any projects done until now – post incentives – have been legacy build-outs of sites that were started during FiT, RoC or CfD phases. In short, most of the cost was already done by the time build-out (eventually) happened.
When the first real post-subsidy site is built, it will be one that went into planning application after subsidy routes were closed.
Regional zig-zag for EPCs and sub-contractors
The figure below shows the share of added capacity each year, depending on the UK region of deployment. The graph shows clearly how solar farm development in the UK has moved from one region to another during the past eight years.
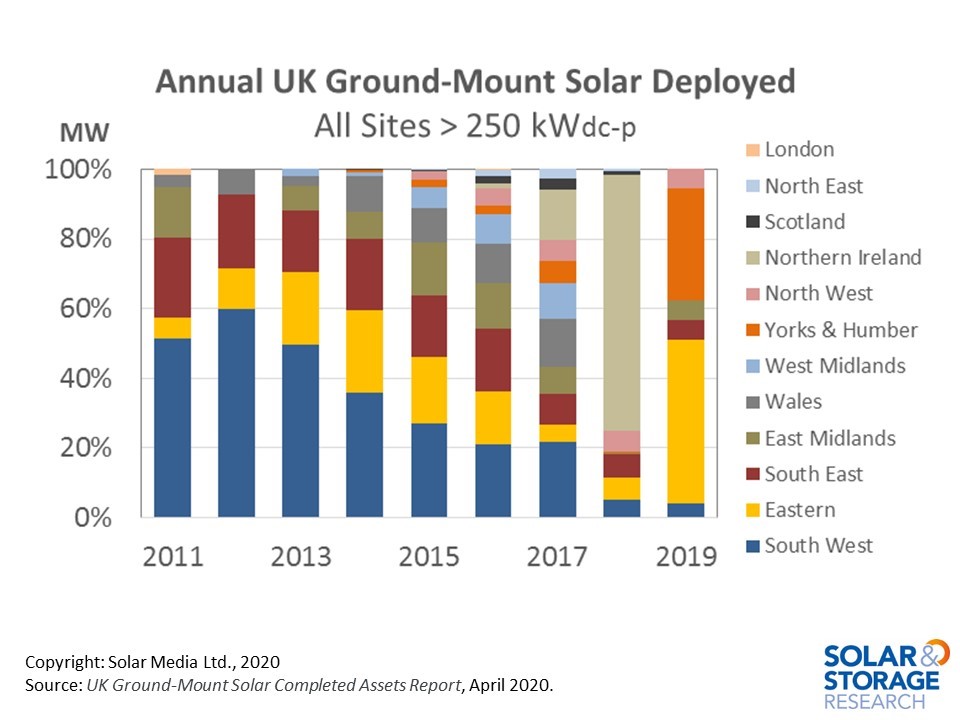
Initial solar farm build-out in the UK was heavily concentrated in the South West (including Cornwall, Devon, Somerset and Wiltshire) during 2011 to 2013, before grid capacity became constrained in this region.
In 2011, solar farms in the South West and South East regions accounted for 75% of capacity added; in 2015, this had reduced to 45%. By the time available RoC size had been reduced to 5MW, these regions were accounting for about one-third of new capacity (2016 and 2017).
During 2014 and 2015, considerable efforts were then concentrated on the East Midlands and Eastern regions, making up about one-third of all new solar capacity in this two year period.
During 2014 to 2017, there was strong deployment in Wales (approximately 780MW). Scotland had its peak during 2015 to 2017, with 76MW (almost 98% of all ground-mount solar in Scotland at the end of 2019). Northern Ireland by contrast was concentrated into the 2016-2018 period, with all of its 196MW occurring during this three year burst.
Regional share splits in 2018 and 2019 are somewhat academic, with the deployment levels being very low during these years. The regional split in 2018 reflects the extended grace period offered by NIRoCs, and was about the only high on offer to EPCs and developers during the year.
By contrast, the pipeline of new post-subsidy projects today (7.3GW) is relatively widespread across the UK with about 1.5GW now in Scotland and Wales combined.
Accessing the full dataset of completed solar farms in the UK
Articles to follow on Solar Power Portal will address various aspects of the completed 8.5GW of large-scale ground-mounted solar farms, including module technology (powers), EPCs and sub-contractors, and current asset owners.
To access the monthly updated full listing of completed projects (and the audit trail of each), please follow the links to the UK Ground-Mount Solar Completed Assets Report at the link here.