This blog forms the second part of a two-blog series outlining that ownership of the entire 12GW of completed solar capacity deployment in the UK.
The first part outlined the background and relevance of the analysis undertaken by our in-house research team, and formed the basis of a presentation delivered on 1 February 2017 at the Solar Finance & Investment Europe conference in London.
Having covered the rooftop segment in the UK already in the first part, the second part of the blog series now turns from to the ground-mount: a segment that accounts for just under three-quarters of solar PV (by capacity) installed in the UK today.
However, before we look below at what is generally referred to as solar farm territory, we have to remove a small ground-mount segment that is shown in the slide below.
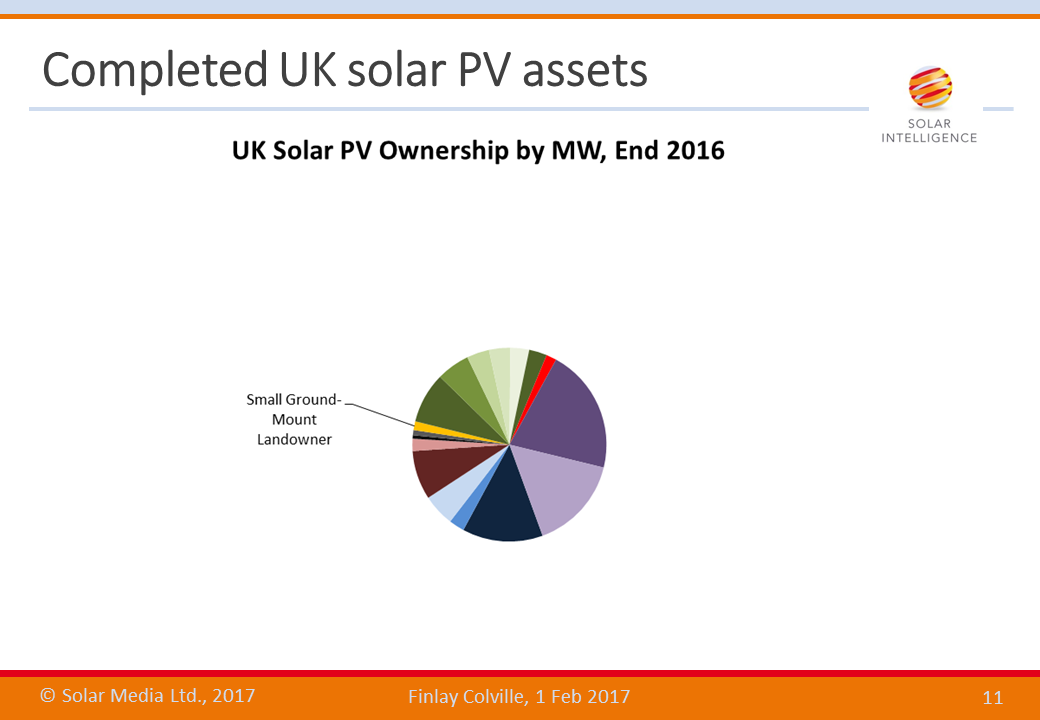
During the early days of the UK’s solar market growth, the farming community was actively installing small (typically 249kW) ground-mount sites, located on their farms. Indeed, this segment almost had its own dedicated network of small solar farming installers, typically doing one 249kW installation each month. While FiTs were attractive, this segment was buoyant. It continues today in a smaller variant, largely confined to water utilities.
We differentiate it from solar farms, with the 249kW ground-mount sites better grouped from an ownership perspective with the small commercial rooftop segment covered in part one.
Now we get to the key part of the UK’s 12GW of solar assets: large-scale solar farms. This is the segment that brings solar to the city, perks the interest of the financial community, makes the connection between solar panels and pension funds, and stimulates secondary market trading and business opportunities. It is also the primary reason why the UK was the key European market for solar the past few years.
The UK large-scale solar farm segment is dominated by sites typically ranging from 5MW to more than 70MW, across a total of 1,021 solar sites adding up to 7.6GW. This has all been installed between 2011 and today, and has been financed mainly from ROCs, with a chunk of FiTs (regular and community variants) and a sprinkling of Contracts for Difference (CfD) projects. Some of the revenue streams come from a combination of the above, combined with private-wire PPAs.
Broadly speaking, there are four different parts of this 7.6GW, and these are described across the following slides.
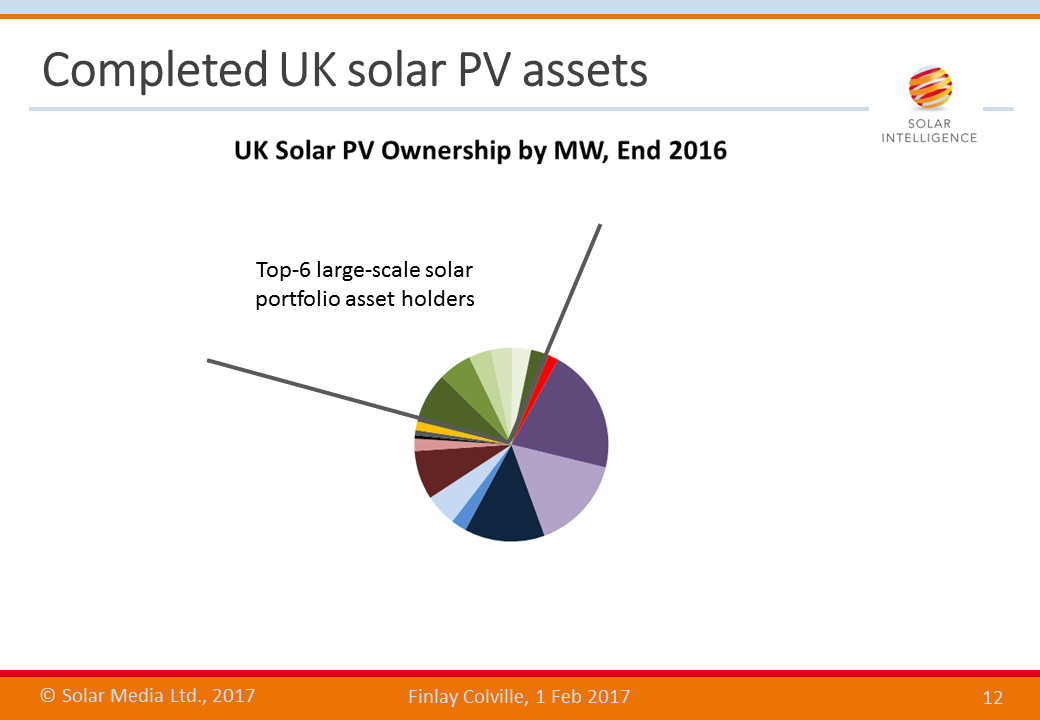
First, we split out the top-6 (or big-six) asset owners within the large scale solar farm sector. These six companies have portfolios well above the others, and have similar long-term drivers that set them apart from many of the other single or multiple site asset holders. These big-six asset owners account for just over a quarter of the entire solar capacity installed in the UK today. The six companies are now spelled out in the slide below.
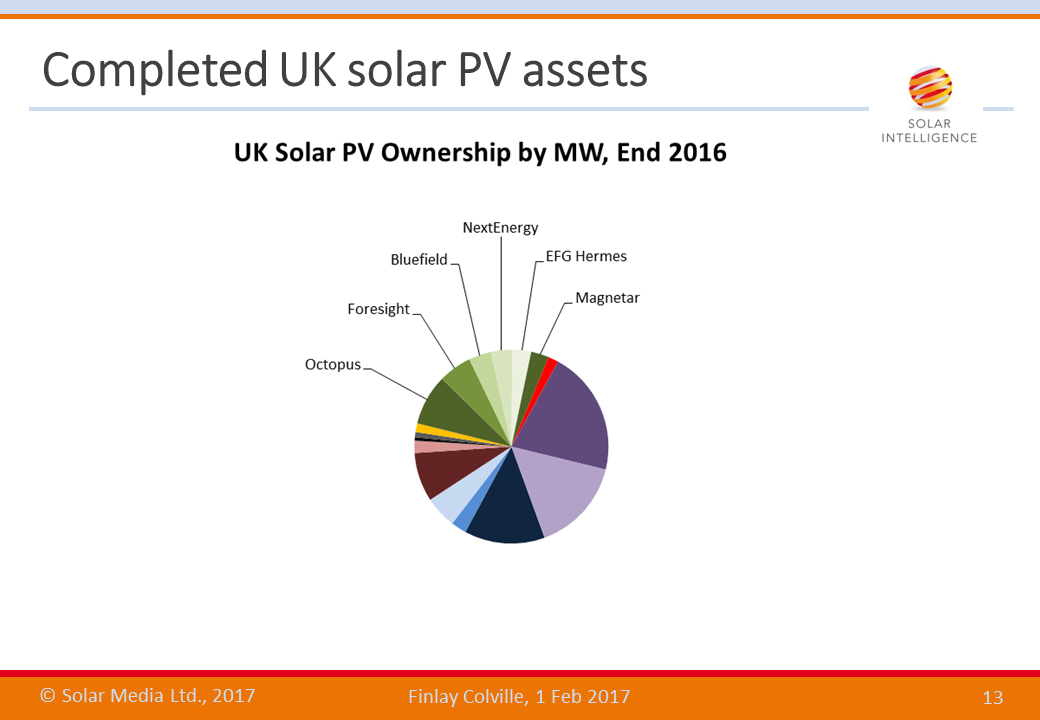
Octopus and Foresight have emerged in the past 12-18 months as the two companies with the most ambitious goals for GW-level solar asset ownership. Indeed, since I gave the presentation last week, and our in-house research team compiled the analysis, Foresight closed a transaction to acquire the largest solar farm in the UK, which would see the size of Foresight’s pie-segment above enhanced.
Bluefield, NextEnergy and Magnetar can also be grouped together as companies that have been steadily accumulating assets, mainly through having secured first option on purchase for sites that are at the shovel-ready phase. Bluefield has been more active further upstream at the project development phase. Magnetar has been more aligned to key partners at development and EPC phases as the default yield vehicle.
The inclusion of EFG Hermes is a unique case. The company had no active play in the UK solar industry, but moved into the upper echelons exclusively through its one-off acquisition of TerraForm Power’s UK portfolio deal a few weeks ago. This was the subject of a dedicated blog we posted recently on how this marked the end-point of SunEdison’s colourful UK market foray.
There are many different asset owners, outside of this big six, that have similar business models, but own smaller portfolios. In fact, there is about 4GW of solar farm assets with a highly fragmented ownership profile. Some are seeking to grow to a few hundred megawatts, either to flip or to hold in the mid-term; some are simply going to expand to the 50-100MW level and then take to market; others are sitting on a few sites that were necessary to buy as a means of executing EPC services; and there are others that may be happy to claim ROC certificates ad infinitum on single sites.
However, before we look at this ‘hot’ 4GW pot, we need to remove one of the large-scale solar farm segments from the mix, and this is explained after the next slide graphic that maps out its relative capacity size.
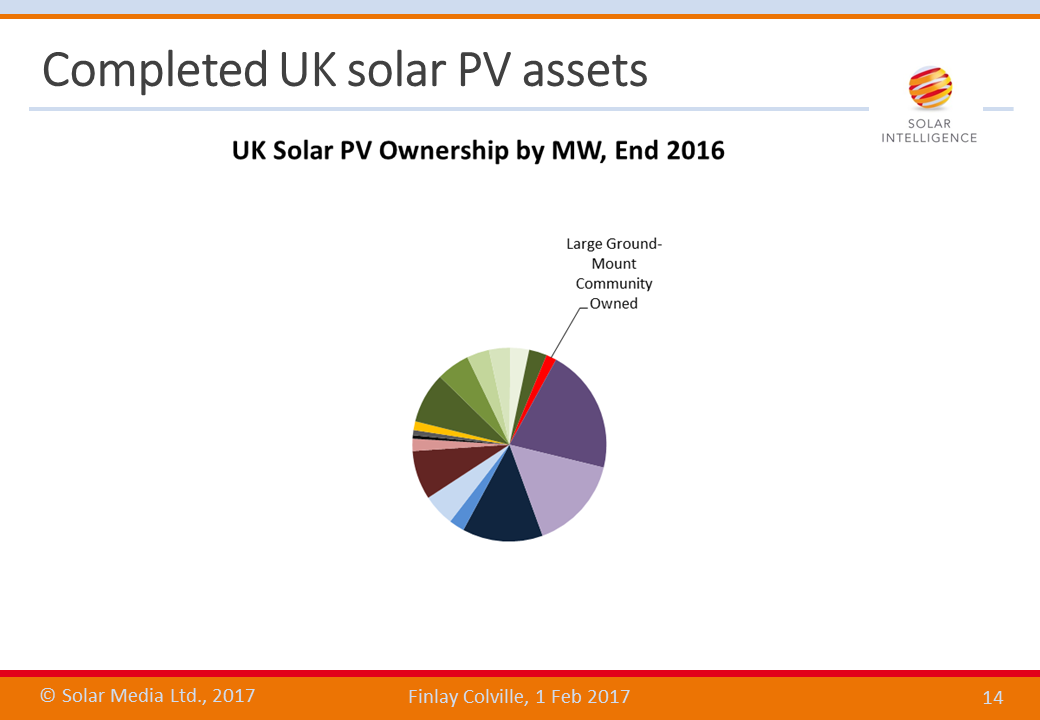
Community involvement in solar farms in the UK has been prevalent ever since the UK industry received its first round of government incentives in 2010. However, it is really a game of two halves.
Initially, community-owned solar farms were few-and-far-between and largely operated on the periphery of city-money-driven solar farm deployment. Prior to the government changes to large-scale FiTs in May 2014, the appetite from the leading companies serving the large-scale solar sector for community investment in sites was non-existent. Relying on community (or crowdfunded) finance was known to be painstakingly slow and out of synch with the act-now philosophy required to grab a government backed incentive rate before any impending deadline.
The changes of May 2014, coupled with the government stating that CfD auctions for solar would not be an ongoing concern, effectively rendered a bunch of >5W solar farm developments as distressed unless they were downsized to 4.99MW or split up in size. The availability of community-based FiT banding, together with the beauty of pre-accreditation, allowed the more pro-active developers to carve up >5MW planned sites into 4.99MW plot sizes.
While challenges remained for separate connection points, the above factors created a mini-boom of community-based large-scale solar activity, and an upturn in the creation of Community-interest-Company (CiC) legal entities (or special purpose vehicles, SPVs).
This segment of the large-scale ground-mount sector needs to be ringfenced from the other (falling under the more generic label of ‘utility’) portfolio asset addressable market.
Once this community-based element is taken out, we are then left with the real action in the UK market today: namely, the part that contributes to the secondary market trading that is set to unfold in the next 12 months.
In this respect, there is one big challenge for many of the existing or prospective portfolio holders that want to buy completed sites: how big is the opportunity and who owns all the sites? At the end of the day, the only way to get to this number is through knowing the status of all the sites that make up the 4GW stack that we segmented out above.
In order to get the answer, our research team went through every site in the UK that falls outside the big-six. This is shown below.
We decided to split out all the sites making up the 4GW total addressable market (or TAM) into two generic categories: sites owned by companies that we felt were part of a long-term asset-play; and companies that owned sites that were likely building up portfolios as part of a pre-determined flip strategy, or would probably need ready cash soon to fund parallel business priorities that are currently having a negative impact on bottom-line investor returns.
I will explain this more below, as there is quite a lot going on here other that simply tagging each site with a binary yes or no, in terms of being up for sale in 2017.
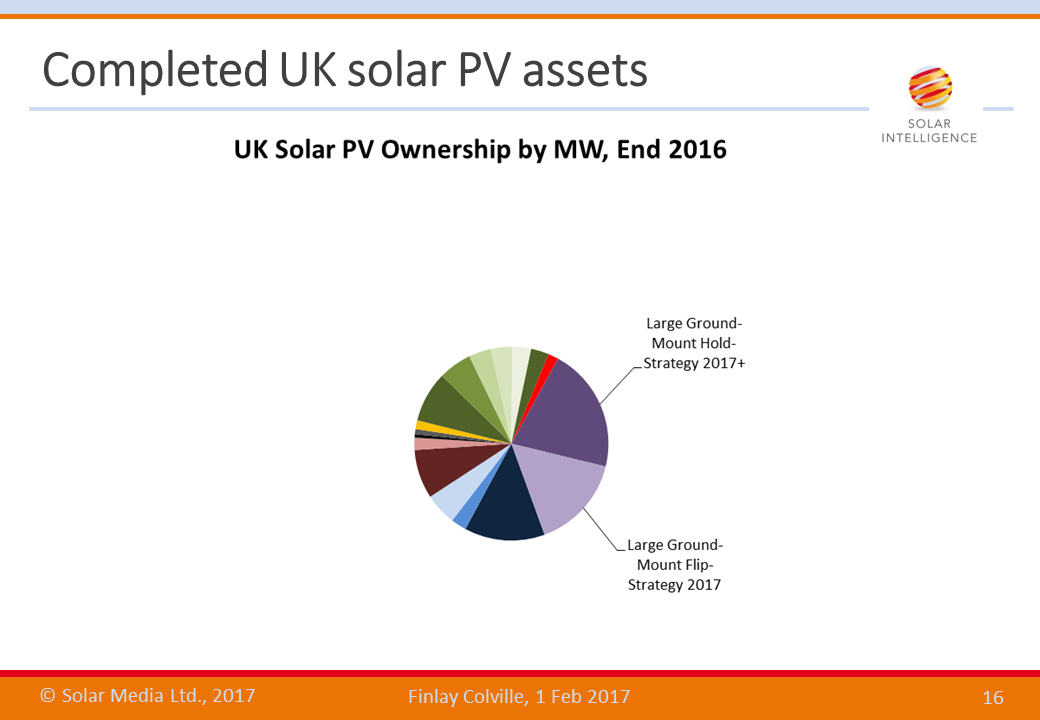
Before I get into this, let’s look at the nomenclature used to describe the two segments here, as shown in the above slide graphic.
The capacity and sites making up the ‘Hold Strategy 2017+’ pie-segment contains the sites that we believe are part of longer term hold tactics, and as such the ownership is unlikely to change hands in the next 12 months.
By default, this leaves the other pie-chart segment – ‘Flip-Strategy 2017’ – as the one that answers the burning question in UK solar today, in terms of making up the secondary served addressable market (or SAM) in 2017.
Of course, the gut-feel approach is far from rocket science, but there is quite some background intelligence driving our research here. Let’s now touch on this.
One issue is a key driving factor in global solar industry dynamics that has ravaged the overall landscape in the past 12 months, namely the chronic collapse of module average selling prices (ASPs). For many of the Chinese companies that have been active in the UK in the past few years, this is currently foremost in their tactical planning for 2017.
A few years ago, a trend started – fuelled in part by the yieldco fad that quickly became the darling of the investment company but was then discarded as somewhat toxic asset territory – wherein legacy solar module suppliers created projects-based business units that would take ownership of shovel-ready sites.
Horizontal activities were created to finance solar farm build-outs and set up EPC-based operations, either from mainland Europe or US-based locations. Funding was made available for these in-house developments, and as a result, the UK has seen high levels of solar farm ownership now residing with these Chinese headquartered entities.
The problem though is that these companies are still largely influenced by short-term cash-flow, and this comes principally from third-party module sales. Therefore, if global ASPs for modules collapses, operational margins are hit hard, and the focus shifts quickly to immediate cash generation, and downstream solar farms on the books move quickly to the top of the list of offload-able asset list.
As such, within our 4GW TAM here, we can largely tag all assets owned now (or by 31 March 2017) by Chinese-based entities as comfortably falling into our ‘Flip Strategy 2017’ grouping, with Canadian Solar’s UK portfolio being potentially top of the list for the big-six (or new entrants) to acquire in the next 12 months.
Other generic factors were applied to determine the full list of sites falling into the ‘Flip Strategy 2017’ segment shown above.
We ended up with a figure of 1.8GW of sites that we believed would change hands in 2017. Applying unknowns to this, it is probably more useful to size the secondary market trading capacity at somewhere in the range of 1.5-2.5GW over the next 12 months, and this gets us finally to the answer flagged in the sub-heading of the introduction slide of the presentation, and the supporting analysis we have done in the past few weeks.
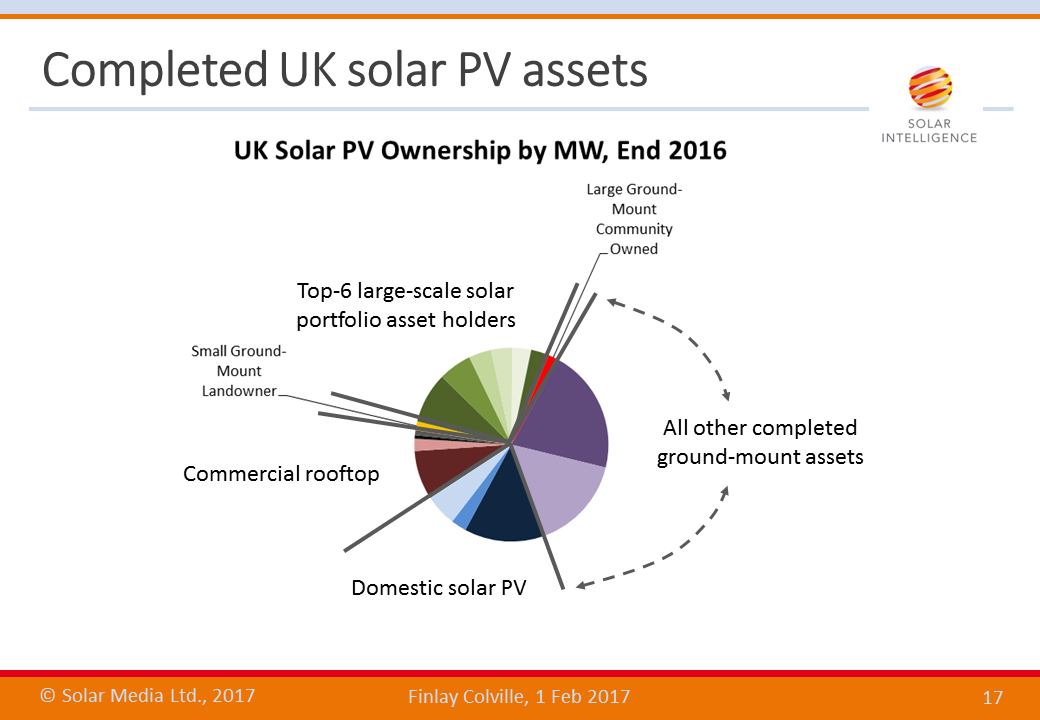
The complete picture: UK solar asset ownership
The presentation concluded by doing a top-level grouping of the pie-segments, as shown below. This serves as a statement today of how the 12GW of solar deployment in the UK is divided up by solar asset class ownership. How this will change over the next few years, and the business opportunities that will arise from this, is likely to be the topic of much debate in the next few years.
Tracking secondary market activity is now the primary focus of our in-house research team, and we continue to monitor new solar farm planning applications, development, build-out and SPV activity.
To access our comprehensive database of 7.6GW of large-scale solar sites spanning 1,021 large-scale ground-mount sites, please follow the details outlined through this link.