With so much planning activity for large scale solar farms in the past couple of years, it can be difficult to really understand what to go after if you are an EPC or component supplier. This is not a new issue for large-scale (or utility) solar, when deployment is the result of uncapped incentives. Only auction based schemes can control capped levels effectively.
So, what you get, for countries like the UK, is a massive build-up of applications submitted to any one of the 400-or-so Local Planning Authorities (or LPAs). And it is not particularly hard to pull together a pipeline if you know where to look and how to use the portals.
Pipelines for solar deployment often include massive numbers, with many industry observers thinking that having a big pipeline number is a sign of credible market research. Not true. The trick is explaining very clearly what the pipeline consists of, in a similar way that any sales person ranks the probability of winning a sale.
Looking at the UK market now, by way of pipeline analysis, can be a daunting task. This article explains just what is going on with regards UK solar farm prospecting, and how sales and marketing departments across EPC, sub-contractor, and component suppliers can best use this data to go after business over the next five months.
Data is sourced from the Wednesday 28 October release of our Report 3 – Opportunity Pipeline database report. This contains all the active solar farms in the UK that are at any stage from Screening/Scoping through to Under Construction. Sites are confined to Ground-Mount only, and at >250kW (DC-peak). (Rooftop and <250kW ground-mount sites come under different categories for sales to track, with different supply-chains; merging these with large-scale solar farms helps no-one right now, so we have chosen not to do this.)
Over the past couple of months, we have been removing database entries that have not been put into the planning portal, and are assumed to be mothballed/cancelled. This includes sites that were captured at Screening Opinion, Scoping or pre-application Public Consultation stages – anything prior to a full LPA application submission. This saw us losing a few GW of potential sites, largely due to the 22 July 2015 RO pull-in announcement from DECC.
The total pipeline today is 7.53GW across 1,020 sites, with the 750MW+ submitted on 22 July 2015 seeing the project count exceed 1,000 for the first time. This is shown at the far left of the figure below.
First up, we take out the remaining Screening/Scoping sites from the filtered pipeline. This takes us to 844 sites at 6GW. All these sites are submitted/validated at the LPA level. We then split those into Under-Construction and Not Under-Construction. Typically, if a site is under construction, it is too late for an EPC, sub-contractor or component supplier to influence decision-making and is pretty much as-built.
The not-under construction pipeline becomes 5.7GW across 811 sites. This is now getting much closer to an active prospect list for sales and marketing departments.
Next, we split these out by funding scheme (RO, FiT, NIROC and CfD), with the 1.3 RO pipeline having two parts (2014 Grace and 2015 Grace). The 2014 grace projects are potentially the key ones for many, if playing with multiple 4.99MW sites is not considered of massive value.
Also, the sites are divided up across the application-stages. We include projects at appeal (either by developer, LPA or Secretary of State call-in based), of which there is a fair chunk of nearly 500MW that will come out positively and get built by 31 March 2016, some that will be upheld but too late for RO (and get moved into CfD possibles), and others that will be dismissed and finally ended.
Application stages also include application status (submitted/awaiting-decision or approved). Of course, approved has the subtle caveat of conditionality and how many conditions need to be discharged before work can start on-site.
The graph below shows how to segment a large-scale project pipeline, and it is a relatively simple process now to assign risk to each of the segments shown. Indeed, at the company level, by knowing the developers for each site and their buying/site-completion trends, an even greater degree of site filtering can be done.
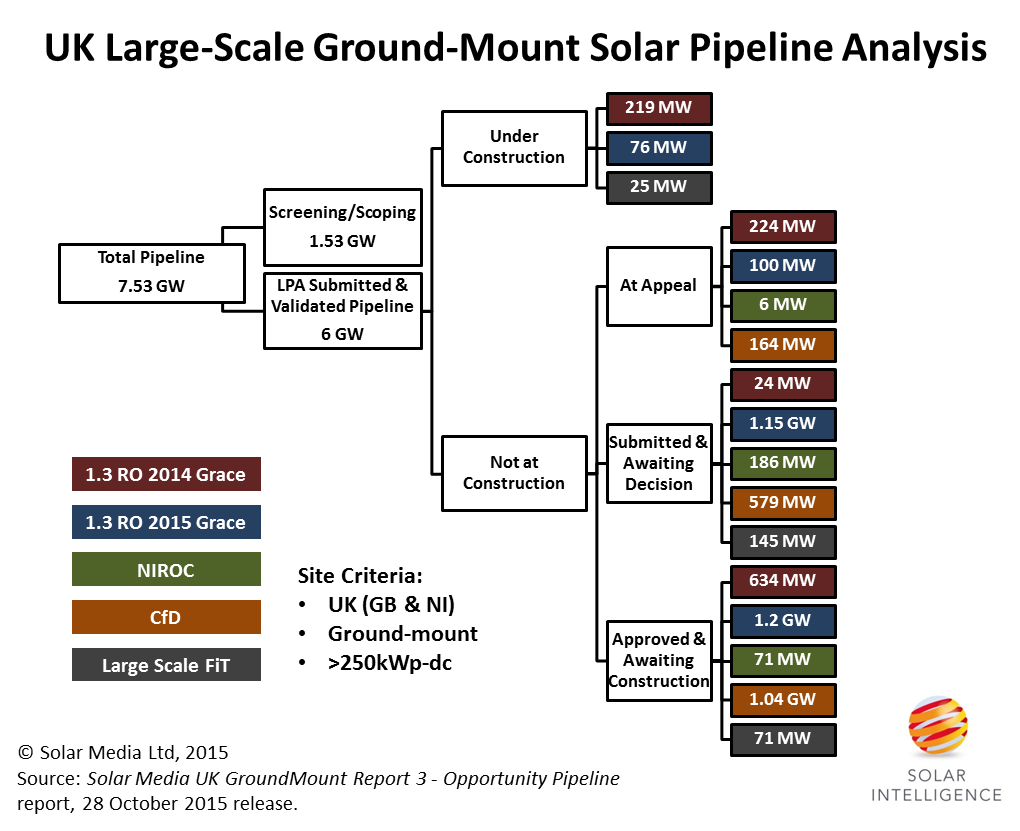
Figure Caption: New analysis of the full pipeline of solar farms in the UK, segmented by different funding routes and application/build-status. Source: Solar Media Report 3 – Opportunity Pipeline, 28 October 2015 release issue.
If what we are saying is that there are 811 sites at 5.7GW worthy of tracking, then the only way to make sense of this in the next few months is to filter – given that the bandwidth of most EPCs and component suppliers can be counted in the 10s of MWs to a few hundred MW max, over a four month period. The only company coming that has delivered anything close to 1GW to the UK in any four month period was SMA with inverter supply during the December 2014 to March 2016 period.
Perhaps the two most interesting pipelines to be looking at right now come under the not-under construction groupings of approved & awaiting construction and submitted & awaiting decision. As we get into January 2016, it will be the former of these two that will become the key category, with applications still not decided by LPAs by mid-February surely running out of time for 31 March 2016 finish.
It should be pointed out also that we are assuming no RO availability after 31 March 2016. Few expect DECC to have a eureka moment and announce in the RO changes that solar can have the final RO fiscal year period with a banding that is of any meaningful figure.
Looking at the two key categories discussed above for not-under construction, we have 3.2GW across about 540 sites. Looking only at applications approved, and this comes down to 1.2GW across 283 sites. Is this then the real pipeline, and if 50% of this is done, the UK can expect 600MW of large-scale solar build-out over the next four months.
Some may think this sounds reasonable? However, some are shooting for forecasts lower than this, saying that investor uncertainty will limit construction finance. Interesting on this one, 12 months ago some fairly well-respected finance firms sent out alarm bells that Q1’15 would be a let-down in the UK because projects would be cancelled – they all got that one wrong and the UK did 2.53GW of solar in Q1’15; a reminder to take some things with a pinch of salt.
Deployment over the next four months will be what it will be, and it would surely be of use to many in the solar industry (UK and globally) for us to shift the analysis here one step further and do full forecasting for UK solar, taking in residential and commercial segments also, out to 31 March 2016 and beyond for the full calendar year 2016.
However, we are sticking to our pledge not to do this while the government is reviewing RO and FiT changes, and is pausing on when the next CfD round will be. Until then, we will focus on sizing historic quarters as accurately as possible and capturing the pipelines for projects, and explaining as clearly as possible what they mean for the industry.
This largely means reviewing the 1,020 projects in the database, using our proprietary methodology for the LPA applications portals, and doing our channel checks with the key stakeholders across the different channels of UK solar farm approval and supply. Removing dead/distressed sites/assets and adding new applications is now critical to keep the database accurate and useable. Full details of all the projects are included in our Report 3 – Opportunity Pipeline database report, released every two weeks. More details are available by contacting us, or clicking on this link.