New research undertaken by the in-house Solar Intelligence team can exclusively reveal that the UK will pass 9GW of cumulative solar PV installed this week.
The current 9GW figure, tracked by our real-time in-house methodology, is now 800MW above the latest DECC estimates for UK solar, valid one month back at the end of September 2015. The difference is due mainly to delays in counting the most recent RO sites and 50kW to 5MW projects under the ROO-FiT scheme.
We can also reveal that, during the first nine months of 2015 (Q1’15 to Q3’15), the UK has added just over 3GW of solar PV. This has been achieved by Q3’15 coming in at 317MW, adding to the 2.53GW in Q1’15 and 253MW in Q2’15.
The graphic below shows the UK quarterly stack, where we have chosen to segment all the categories being tracked into Residential, Commercial and Utility. Overlaid on this graphic is the cumulative figure (shown by the line), just short of the 9GW mark at the end of Q3’15 (30 September 2015), before the activity of the past 5 weeks lifted the total figure to above the 9GW mark.
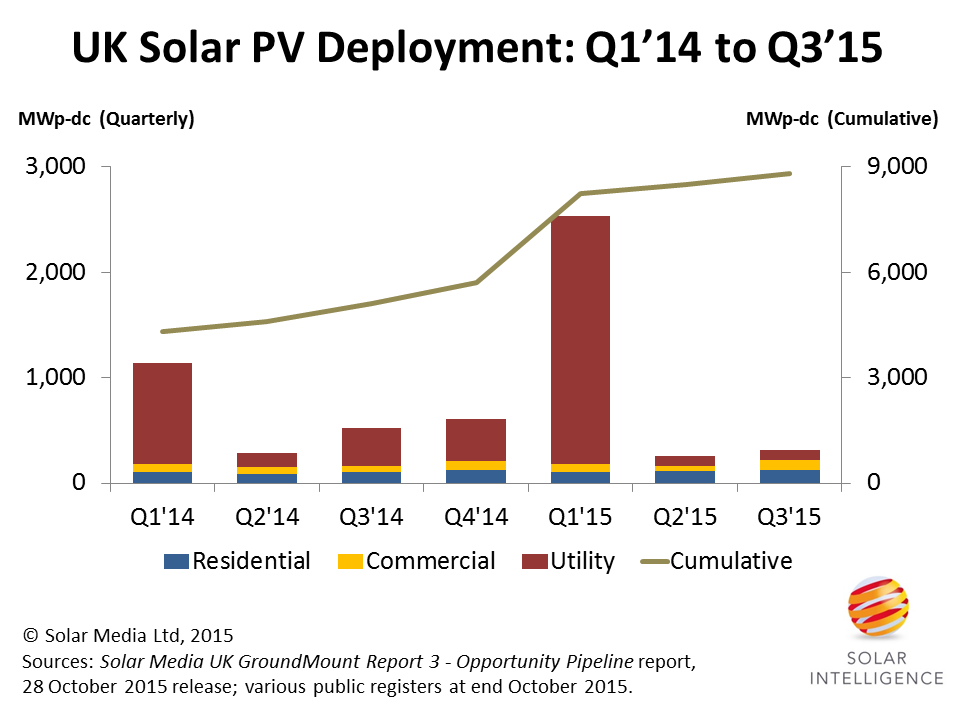
Figure 1: The UK installed 317MW during Q3’15, bringing 9-month deployment during 2015 to above the 3GW level. By the end of the first week of November, the cumulative level of solar PV installed in the UK will pass through the 9GW figure. Source: Solar Media Ltd, 2015.
Last week, we spelled out the full details of the UK’s large-scale ground-mount solar farm project pipeline of more than 1,000 solar farms. Now we will address two of the other segments that are seeing increased focus by the domestic industry: Residential and ROO-FiT.
When DECC released its October 2015 Solar PV data last week, it was sizing the market at 8.2GW at the end of September 2015. The good news is that DECC has just about caught up with our Q1’15 figure of 2.53GW. The bad news is that RO installs and ROO-FiT deployment from 1 April 2015 is now lagging actual levels by some margin. DECC is stating that the six-month period covering Q2’15 and Q3’15 accounted for just 21MW under the RO scheme (1.3 ROs) and 23MW under ROO-FiT.
Of course, this data is not correct, as anyone active in the UK market will know too well. So this goes some way in identifying the difference between DECC (8.2GW end September 2015) and our data (9GW at the end of October 2015). Assuming some updating by DECC for the past six months, and adding in October 2015 government estimates, and we could see the delta being closer to 500MW, but is unfortunately likely to rise every month now for the next six months.
Back to the two segments that were somewhat hidden in DECC’s monthly updates last week, and left many observers thinking that there was actually no rush in UK solar activity, post DECC’s policy changing proposals.
For residential, see the graph below, where the key issue is deployment during September only, and not the quarter. In fact, residential was above 100MW for September 2015 alone, up by a factor of two from the previous two months, and a direct impact of DECC’s proposed FiT changes.
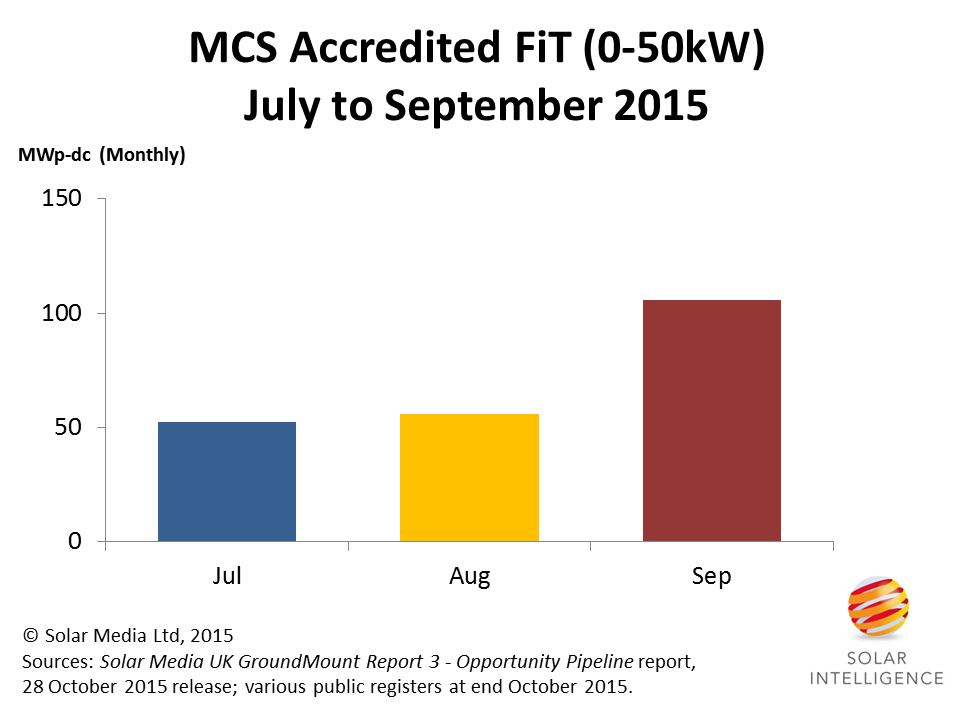
Figure 2: Residential FiT installations doubled in size during September 2015, a direct result of the possible changes in FiT incentive levels being proposed by DECC. Source: Solar Media Ltd, 2015.
The situation with ROO-FiTs is even more pronounced, and has been building up for some time. This is in part due to both DECC’s FiT and RO consultations, with large-scale solar, or stand-alone, seeing strong development activity. The graph below shows the monthly pre-accreditations for ROO-FiTs during 2015, something that is potentially going to have an impact on deployment figures going forward.
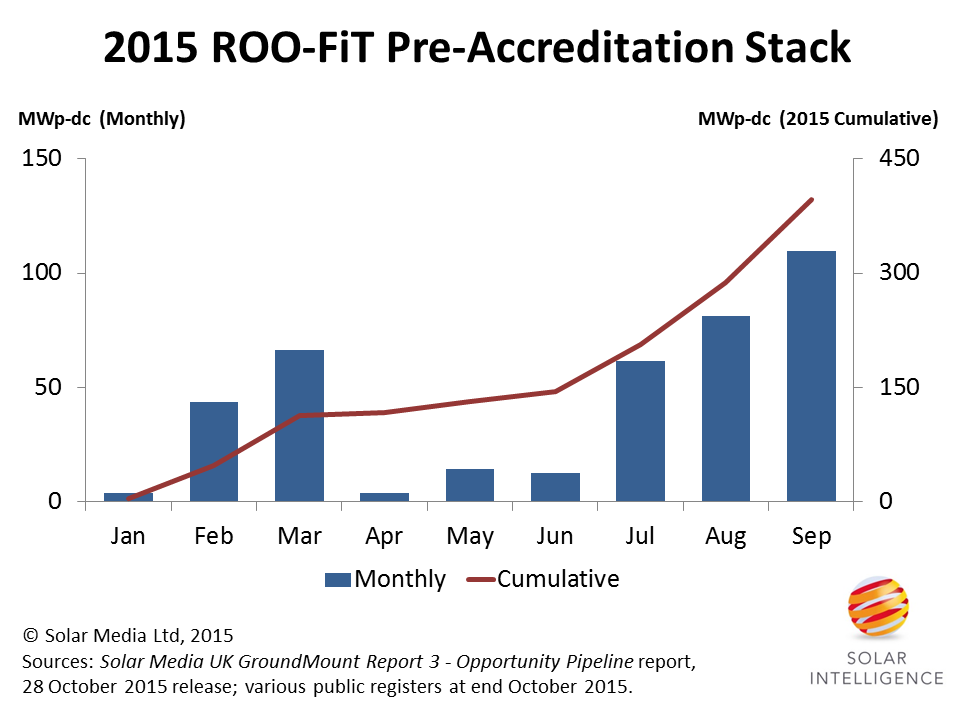
Figure 3: Pre-accreditations for 50kW to 5MW ROO-FiTs have seen a strong uptick since July 2015, with the pipeline stack potentially serving as a final deployment backup if the RO scheme is closed on 31 March 2016. Source: Solar Media Ltd, 2015.
The above two graphics are therefore important in assessing how DECCs proposals have changed activity in UK solar in the past few months, with installers and developers rushing to install ahead of any cliff-edge effect in the next six months.
Of course, the growing pipeline of pre-accreditations is not automatically a sign of strong deployment to come. Nor does the residential spike of September 2015 mean that similar levels are going to be seen before FiTs are cut back. But as leading indicators, they are certainly the best source of data in existence today.
As soon as DECC concludes the FiT and RO consultation phases, we will provide greater clarity on forecasts we have been developing for the next 12 months of UK solar, and these will be reviewed in detail them on the Solar Power Portal website.