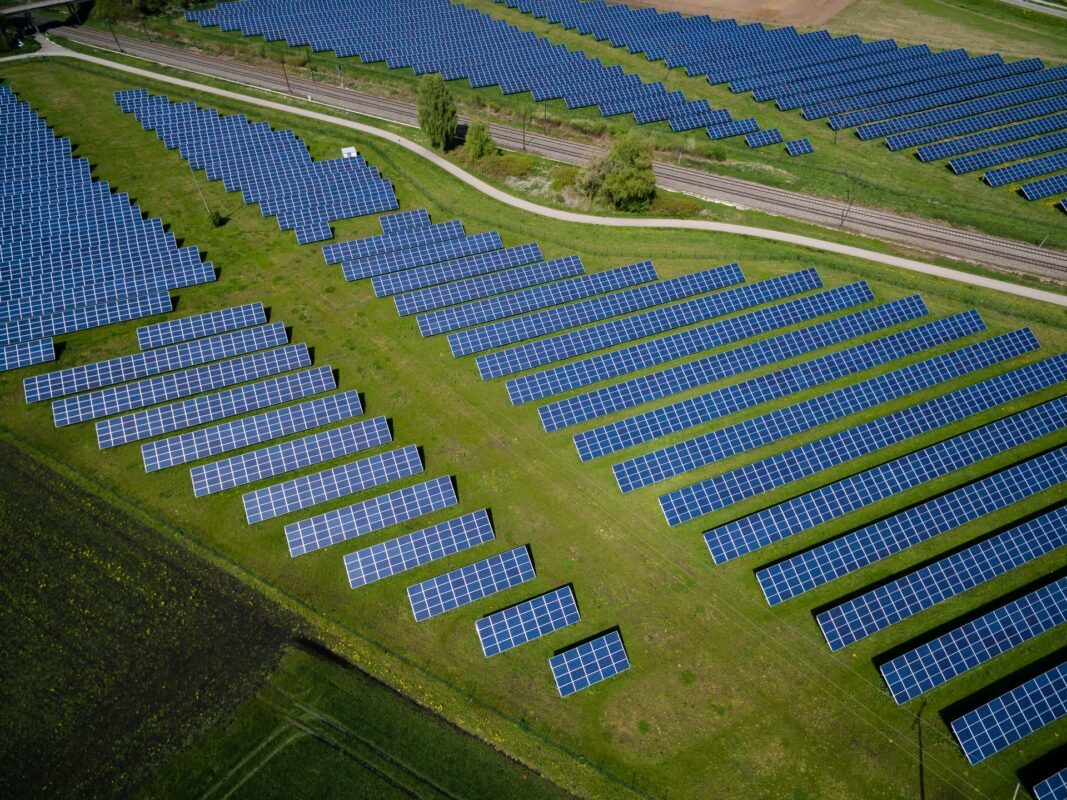
Solar won 2.2GW of contracts in AR4, the first auction round it has been able to take part of since 2015. Image: Andreas Gücklhorn (unsplash).
Last week, the results of Round 4 of the Contracts for Difference (CfD) auction were released, showing that solar PV had been successful in winning contracted supply for 2.2GW of new capacity to be added in the next few years.
This article summarises the key findings, showing where the capacity will be located across the UK, and how it is divided up across site ownership categories by company type.
Mapping the winning projects by audit-trail
Since the UK solar sector kick-started back in 2010, the Solar Power Portal team has been the leading voice covering the market. When the subsidy period for UK solar finished at the start of 2017, our market research team started to compile all post-subsidy ground-mounted projects. And in 2019, we released our monthly database, the UK Large-Scale Solar Farms: The Post-Subsidy Prospect List report. This report includes all projects (legacy carried over from FiT/ROC planning) and new sites that form the pipeline of UK ground-mounted deployment going forward. The pipeline of projects currently stands at 41GW and is growing every month.
Since the report is way more than just a list of projects – it covers full audit trails, owners, site build-out evolution from screening to construction – mapping the 60-plus winning projects in the recent CfD auction was a simple process. Today, we sent out an ad hoc release of the database report to current subscribers, showing them the full details of the 2.2GW allocated in the auction last week.
The following sections summarises the key findings of the CfD Round 4 winners.
Where is all the CfD solar capacity located?
The first thing to say is that sites in the UK are owned by Special Purpose Vehicles (SPVs), and often the naming is legacy and predates any formal planning documentation. Often, by the time sites are sitting in final-owner portfolios, they have been through 3-4 different owners. So, it should come as no surprise that reading off site owners based on SPV names can, and generally does, lead you down a garden path.
Similarly, sites are often spuriously named and quite often are not even close to the town, city or region that appears in their title. Actually, most sites have multiple names; knowing each of them can often be as important as having the correct ownership status for the SPVs.
Even with 40GW of pipeline capacity segmented across a whole range of site-specific auditing, it still took our research team a couple of days to match all the sites up to the listings in the auction release. Having done this, we chose to look at categories that best help to understand the 2.2GW of incentivised capacity.
First, let’s look at where the capacity is around the UK. The timing of this is interesting, with an article I wrote last week on Solar Power Portal looking at all non-Local Planning Authority (LPA) designated projects, and where the Nationally Significant Infrastructure Projects (NSIPs) (and similar in Scotland/Wales) are located. One might wonder if there is a match with the latest CfD results?
The answer to the question above is a resounding ‘yes’, despite the fact that all but one of the CfD sites in England are LPA adjudicated, not at the NSIP level (which was the basis of the geographic breakdown of the England sites in the article last week).
82% of the 2.2GW of CfD solar capacity awarded is spread across the Midlands (East and West), the East of England and the South (East and West). Planned NSIP activity in England is concentrated in the Midlands, the East of England and the South East (more than 60% of national non-LPA pipeline capacity).
Last week, I showed the East Midlands dominates mega-scale (NSIP, Scottish/Welsh Government) adjudicated pipeline capacity in the UK. The results from the CfD auction also follow this trend, with about 25% of awarded CfD capacity located in the East Midlands (in particular Bassetlaw, East Lindsey, and East/South Northamptonshire). The reasons for this were covered in the article last week.
The only difference between NSIP activity and awarded CfD sites, from a geographic standpoint, is the South West; Devon, Dorset, Gloucestershire and Wiltshire account for almost 400MW of capacity.
Who owns all the sites?
Seventeen companies/vehicles own the 2.2GW of CfD solar capacity awarded, but there were four big winners that accounted for half of the total. These four big winners have different business models, so this prompted our team to look at assigning the 2.2GW of CfD solar capacity by company ‘type’.
The largest contribution (31%) comes from six companies that can be grouped as: Site-Build Financing (Institutional & Short/Mid Term Owning). These are the closest to city investment vehicles that traditionally acquired sites post-build, but are now investing earlier, while bringing in finance for construction also.
Five companies can be labelled as: Integrated Developer & EPC (TP-Finance & Post-Build Flip). These account for 25% of the capacity, and are EPC-strong entities that play just upstream (development) and downstream (using third-party construction finance and flipping post-build).
Four companies can be assigned as: Pure-play Developer (Pre-Build Flip). These companies are the closest to early-stage developers by trade, most often selling approved/consented sites to others (including the above two categories). These four companies account for about 24% of capacity. This is potentially capacity that could go through ownership changes in the coming 12-18 months.
The final category is: Site-Build Financing (Utility & Long Term Owning). This is a grouping specific to utilities (UK/European/Global) that have full value chain participation as part of long-term ownership (typically within a targeted renewables goal). Two companies here account for about 21% of allocated CfD capacity.
How each of the companies above progresses with their allocated CfD capacity will ultimately determine the role of suppliers and partners needed to bring the sites through to completion. Some will rather micromanage the entire process; others will rely on sub-contractors to bring in much of the know-how and expertise. But all will likely be different, in terms of site-specific tactics.
How to learn more about the solar CfD projects
There are now several routes that help in this regard.
The most useful tool is the UK Large-Scale Solar Farms: The Post-Subsidy Prospect List, newly refreshed today to allow filtering out all the 2.2GW of solar CfD projects, fully detailed across a wide range of pre-build/ownership categories. More details on how to subscribe this monthly-released report can be found here.
Next week (Wednesday 20 July) I am delivering a free online webinar, covering all things UK solar at the moment. This will of course include CfD activity but will also cover UK deployment and pipelines now for rooftop and ground-mount segments. Details on how to sign up to the webinar can be found here.
Finally, we will be including a CfD-specific session in the upcoming UK Solar Summit event in London on 14-15 September 2022. Details on how to attend or be part of this two-day event run by Solar Power Portal's publisher Solar Media can be found here.