After some two years in the wilderness, the UK market will see the start of subsidy-free (or post-subsidy) large-scale solar farm deployment in 2019.
This article explains what to expect, why this is happening, and looks at the scale of the opportunity on offer to EPCs, component suppliers (modules, inverters, mounting) and ancillary sub-contracting services that support new site construction.
The full list of all large-scale (>250kW) ground-mount solar sites in the UK, currently classified in our pipeline, can be found in the latest release of the UK Large-Scale Solar Farms – The Post-Subsidy Prospect List report, details of which can be found here.
But what about the two subsidy-free projects already built?
Before I start on the full analysis and discussion, let’s get one thing straight. There have been no legitimate subsidy-free solar farms built yet in the UK.
But I hear you say: what about Anesco’s Clay Hill Farm in 2017, or the West Sussex Council’s Westhampnett project? Were these not the first two post-subsidy UK solar farms?
Not really. Anesco’s site was a hastily constructed follow-on phase of a legacy ROC-build site that had planning and grid-connection costs written off, and was (likely) using components from component-supplier partners from China (BYD, Huawei) that may have been more sweetheart-deal motivated than commercially driven. Everyone wanted to show a success in a post-ROC era, and the press (and government) obliged in propagating the myth that the UK could exist overnight in the absence of subsidies. In reality, Clay Hill was a distraction: not a help for the UK solar industry.
And forgive me also for some cynicism, but seriously – are we really to believe that a local council (not entities known for their supreme fiscal prudence) is going to be front-runner in UK large-scale post-subsidy build-outs! The Westhampnett site had been in the planning for several years, and was fundamentally an exercise in sustainability-target driven marketing euphoria.
In isolation, neither of the above sites would likely have passed any due-diligence analysis by an external investor, and should not be considered for inclusion in a discussion of how the UK has reacted to the removal of FiTs, ROCs and CfD incentive mechanisms for solar sites in recent years.
So, what has been happening?
Later in the article, I will outline data to show the boom-and-bust cycle of UK solar that existed between 2011 and 2018. For now however, let’s look at the action behind the scenes that has paved the way for the start of the real post-subsidy activity in 2019.
Once the ROCs (GB-specific ones) expired on 31 March 2017, there was the expected stoicism on the part of developers, mostly coming from players that had nowhere else to go. Much of this was false hope and the vast majority left the sector. Others had been making moves to get involved in overseas markets (southern Europe, MEA/LATAM and Australia) so this simply become the main focus to any new solar capacity additions.
Non-UK EPCs did what they normally do when subsidy-markets come to an end; they leave. This also applied to the raft of mainland Europe developers that had arrived in the UK in 2011 and made hay under the RO period.
However, the fact that we have a 2019 pipeline of build-outs can largely be credited to one of the existing major solar asset owners in the UK. Many other city investors talked-the-talk about driving UK subsidy-free solar, but when it came to action, only one got its hands dirty in the painstaking process of scanning every site on offer from former planning activity, while also moving upstream in the value-chain of a solar farm and being a driver of planning development (aligned with experience planners that had been engaged with one of the main developers of the subsidy era).
Two other project developers kept in the loop also. One (based in the north of England) returned to a desktop screening frenzy, but with no indication of any full planning application anywhere to be seen. The second company in question set about a radically more professional approach and has a pipeline of projects that no other company can lay claim to today in the UK.
Somewhat on the periphery we have the Cleve Hill and Little Crow mega-scale projects that are currently going through national infrastructure importance adjudication. Central government has done a great job in the past few years of favouring anything but solar in the UK, and any large projects needing sign-off under ‘national importance’ have to come with a massive dose of risk. However, governments are short-lived thankfully, and any change has to be a good one surely?
Either way, neither Cleve Hill nor Little Crow will be among the first wave of post-subsidy UK solar farm build outs, so they can be easily decoupled from the real activity of 2019 that is the focus of this article.
The pipeline revealed
When the ROCs expired in the UK, there was a pipeline of uncompleted projects that amounted to almost 4GW of capacity. Over the past 18 months, new sites have been added, but many more removed from our analysis.
In fact, our in-house research team at Solar Media has only now completed a six-month research period where we have streamlined the pipeline to approximately 130 solar farms (250kW to 350MW) that we believe can be considered as truly ‘live’ today, with a total of 2.53GW capacity.
The best way to explain this is with data and graphics.
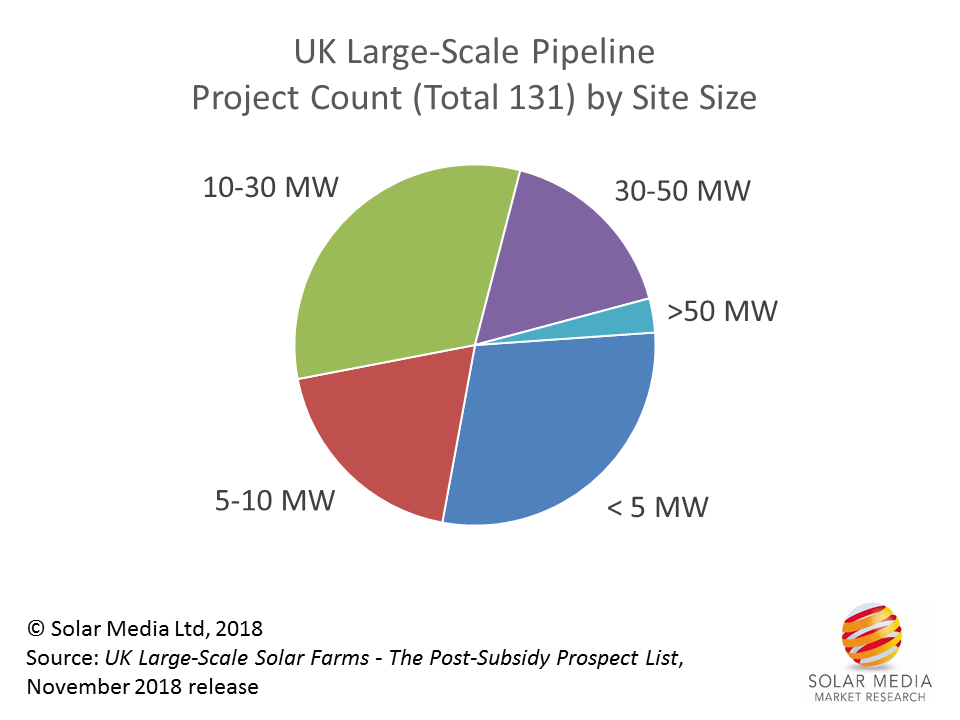
Figure 1: Most of the projects fall into 10-30MW size band, driven by the requirement for post-subsidy projects to benefit from economy-of-scale. Many of the smaller projects (<5MW) are part of the water utilities’ continued solar roll-out plans.
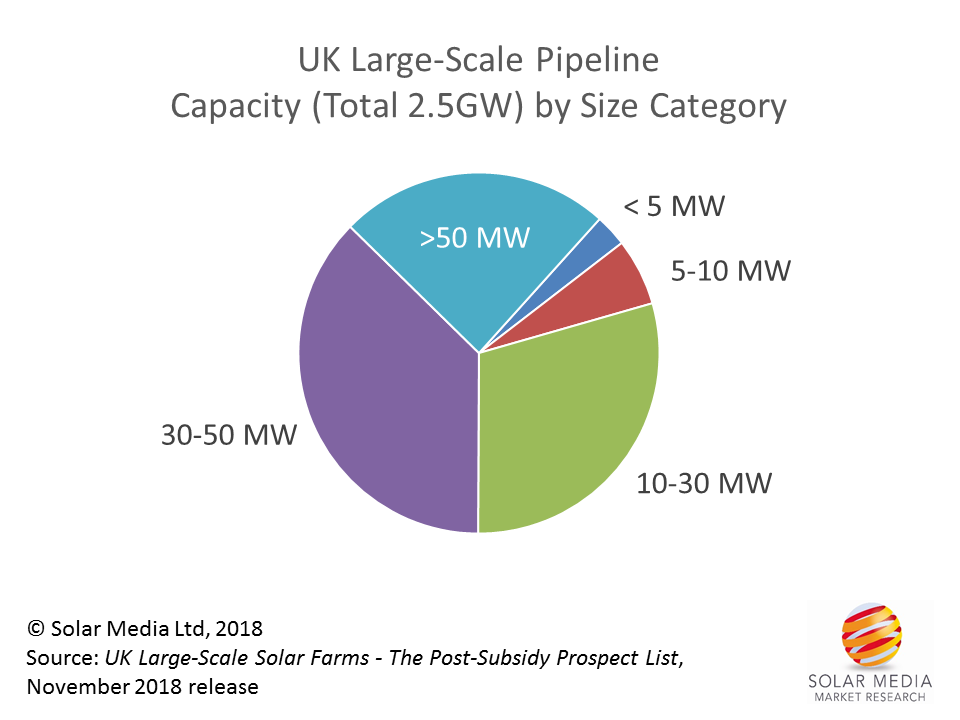
Figure 2: Most of the 2.5GW of pipeline capacity falls across projects ranging from 10MW to 50MW, again highlighting the importance of scaling up the build-sites post-subsidy.
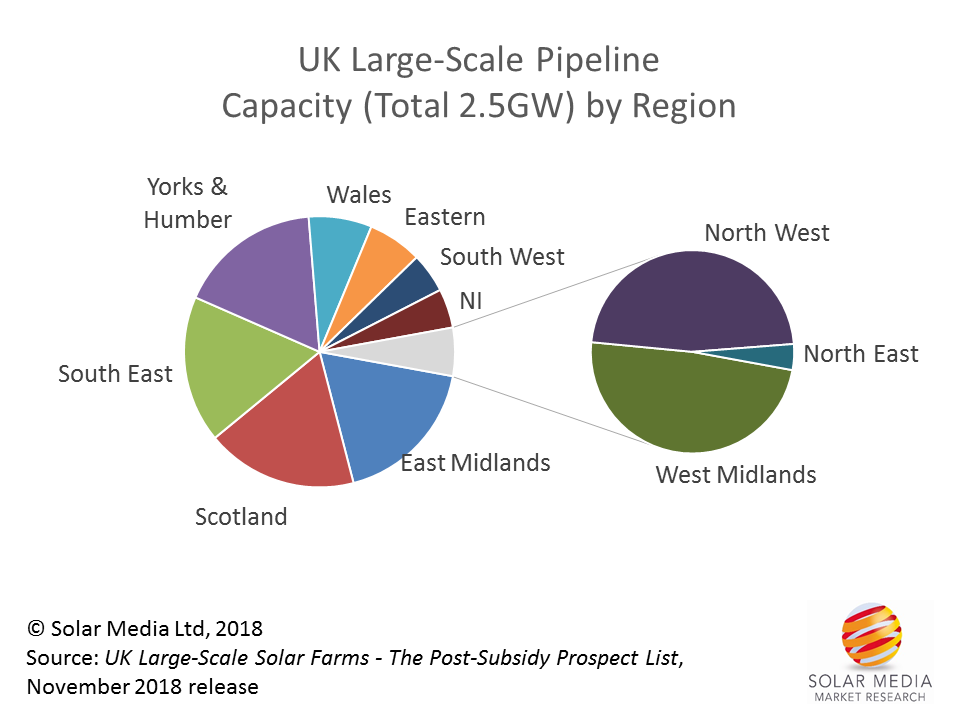
Figure 3: In contrast to the original solar rush in the UK (from 2011), there is a relatively broad geographic coverage for the current pipeline. Two of the favoured regions from before (that included counties such as Cornwall and Norfolk) see limited activity due to grid constraints.
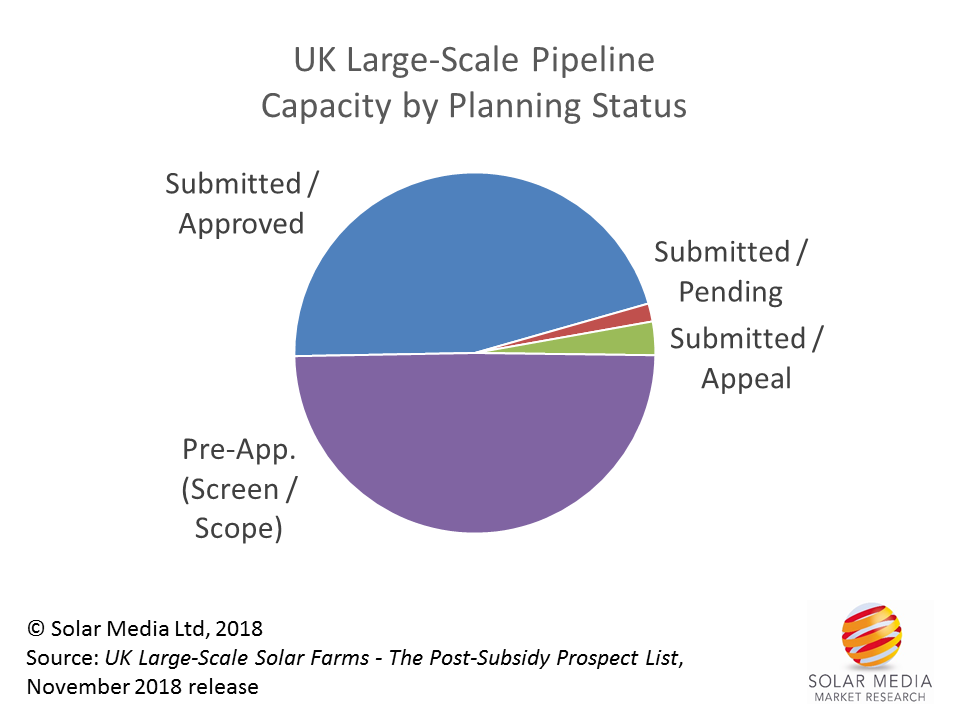
Figure 4: About half of the 2.53GW of pipeline capacity is coming from projects that have full planning applications submitted (either awaiting decision, approved or at appeal). The other half is comprised of projects not yet at planning, with a number of these not likely to be turned into full planning applications.
Before we go any further, a note on our methodology, in particular on pre-application sites. We keep projects officially submitted for EIA for a maximum period of 12 months, before deleting them. For the smaller projects (<20MW), if an EIA is required, we remove the site immediately from the pipeline. If a planning application has not been submitted within 12 months of the screening option, we remove the site also. There are only two – three sites that fall outside this method. This means we keep the pipeline as relevant as possible and are continuously flushing out the speculative screening opinions that are simply left as legacy planning portal entries.
While on the topic of methodology, it is worth noting that the project count about 12 months ago for the pipeline was well above 400 sites. However, we went through every site (especially the legacy ones) and if there had been no activity, we deleted the entries as abandoned/mothballed. This again helps keep the count number of 131 projects as real as possible. Finally, scant regard is paid to the theoretical expiry date (3 years) on planning approvals, as it is not difficult to extend the application validity period for experienced planning consultants.
Back to the analysis now of the pipeline.
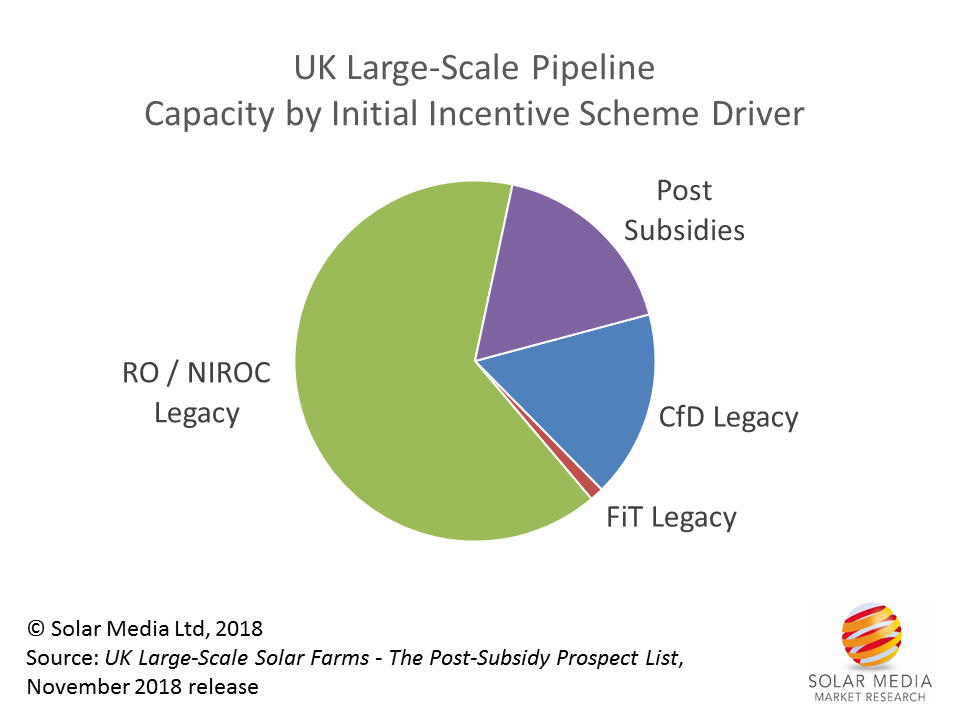
Figure 5: More than three-quarters of the pipeline capacity comes from projects that were originally conceived during the planning-valid incentive days of UK solar subsidies (RO, FiT, CfD). The purple segment represents the ‘real’ post-subsidy new planning application phase, and this is expected to increase annually going forward.
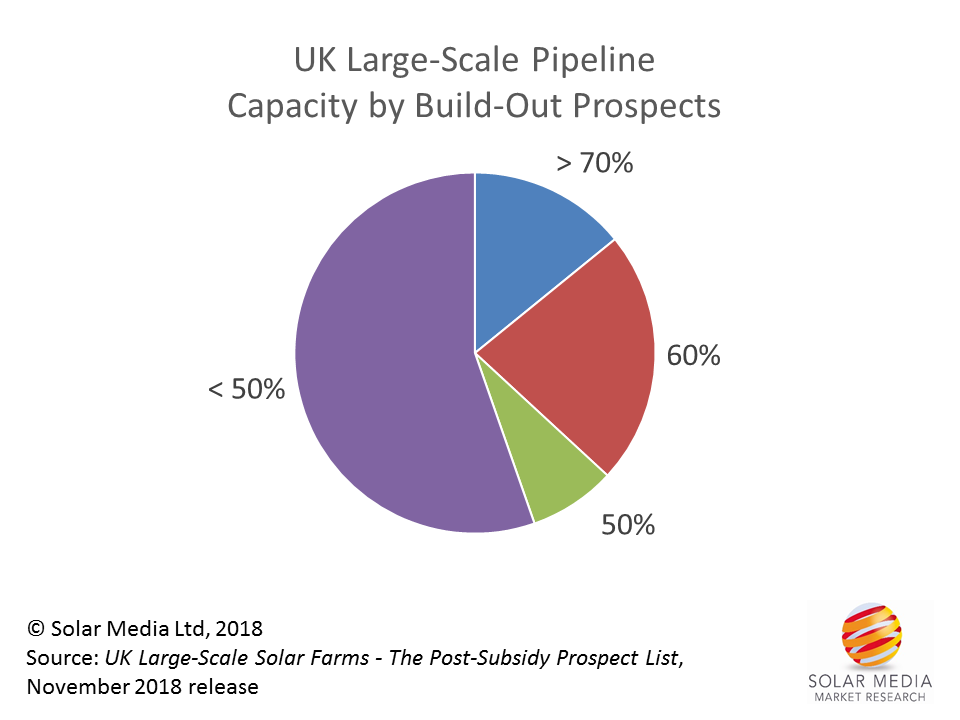
Figure 6: With 0% (project dead) and 100% (project completed/built), the above graphic shows that about one-third of the pipeline capacity (60% and above build-out likelihood), or approximately 800MW, is currently considered as potentially built (spanning the period 2019-2020). However, just a small part of this in 2019 would show the UK to be in positive solar farm growth territory.
As an aside, about 1.3-1.4GW of the 2.53GW capacity pipeline is comprised of new solar farm builds where ESS is an option (although often just namedropped in planning applications to keep all options on the table before seeking conditional approvals). Only a tiny amount (<10MW) is co-located with onshore wind. The rest is all based on stand-alone solar farms.
What can we expect to get built in 2019?
This has been the key issue we have been tracking now for the past couple of years in the UK. And we can at last reveal that many of the projects in the pipeline are getting ready to break-ground either before the end of 2018 or during the first few months of 2019. These projects will be the first to count as post-subsidy projects, all completed during 2019.
There are many drivers for the projects being fast-tracked now. Some of them are teetering on planning application expiration, and would rather not have to return to getting build-out timelines extended. Another factor we are hearing about is Brexit, and the fact that current economic models are set up now and nobody wants months of uncertainty thrown in once Brexit moves to the next level.
Indeed, for Brexit, we could have other factors that introduce unknowns to the equation.
The graphic below shows, for the first time, how the large-scale ground-mount segment of the UK has been progressing since the start of 2017. This includes the forecast for the current 2018 calendar year (with YTD large-scale ground-mount installations at approximately 96MW), and – more importantly – what might happen during 2019. We will be returning to this now on a quarterly basis, to see exactly how things evolve.
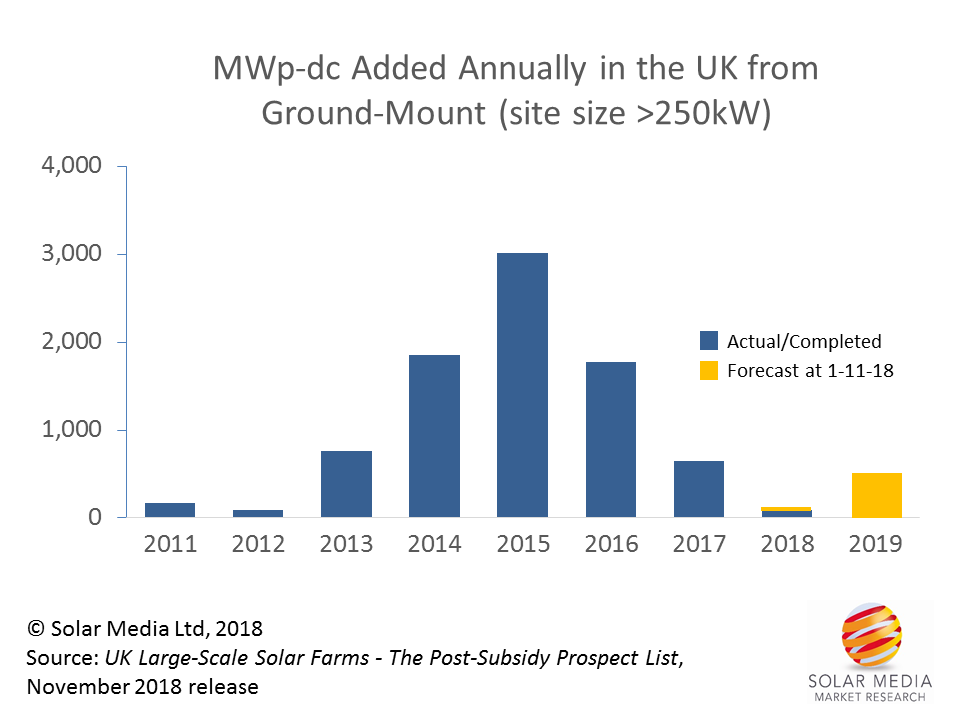
Figure 7: Deployed solar capacity (MWp-dc) annually in the UK from 2011, specifically from ground-mounted solar farms with built site capacity threshold set at >250kW. Deployment during 2018 is likely to be approximately 110-120MW, growing with the start of post-subsidy in 2019 to anywhere in the 300-600MW range.
EPCs and component suppliers need to get active now!
Once we get into the subsidy-free build-out phase in 2019, it will likely be too late for many that would like to have revenue streams again from UK solar farms. However, what is due to happen in 2019 is not a bubble, and therefore, it would still seem to be good timing to get connected again with all the stakeholders behind the 131 active sites (and indeed the new ones to be added to the pipeline in the next 12-18 months).
All this information is available in the UK Large-Scale Solar Farms – The Post-Subsidy Prospect List report, which can be found here. This report uses all the internal resource from the Solar Media research team that has been tracking the UK solar market from well before the start of the FiT scheme before 2010. The database is widely regarded as the most accurate sales tool available for anyone seeking to benefit from UK solar farm activity.