According to details contained in the first release of the new UK Large-Scale Solar Farms: The Post-Subsidy Prospect List report, from the in-house market research team at Solar Media Ltd., the pipeline of large-scale ground-mounted solar farms now exceeds 3.5GW, across more than 330 sites.
This article takes a look at summary data from the new report, providing key trends and indicators of the pipeline, consisting of potential solar sites that could be built during 2018-2020, in the absence of legacy FiT and RO revenue streams.
The first graphic below shows the allocated pipeline capacity, segmented by site size.
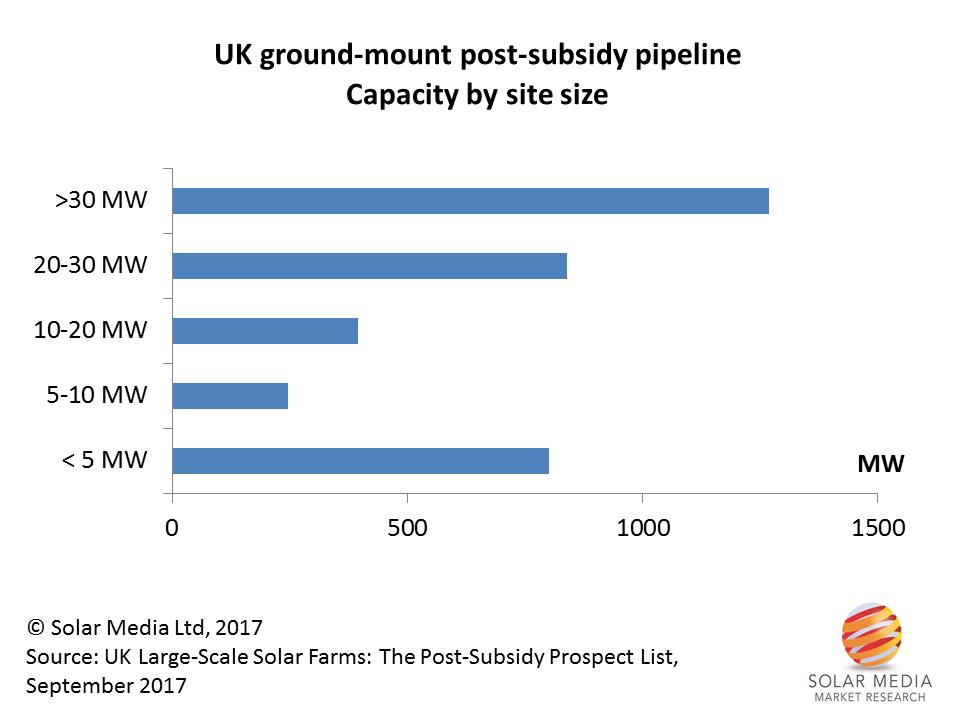
Capacity is dominated by large sites, above 30MW in size. The contribution from the <5MW site size grouping is based mainly on distressed or surplus capacity coming from legacy RO applications that were either not completed before 31 March 2017, or downsized to 4.99MW to enable 1.2ROC accreditation.
The next graphic shows the geographic split by pipeline capacity, using standard regional segmentation covering Great Britain and Northern Ireland.
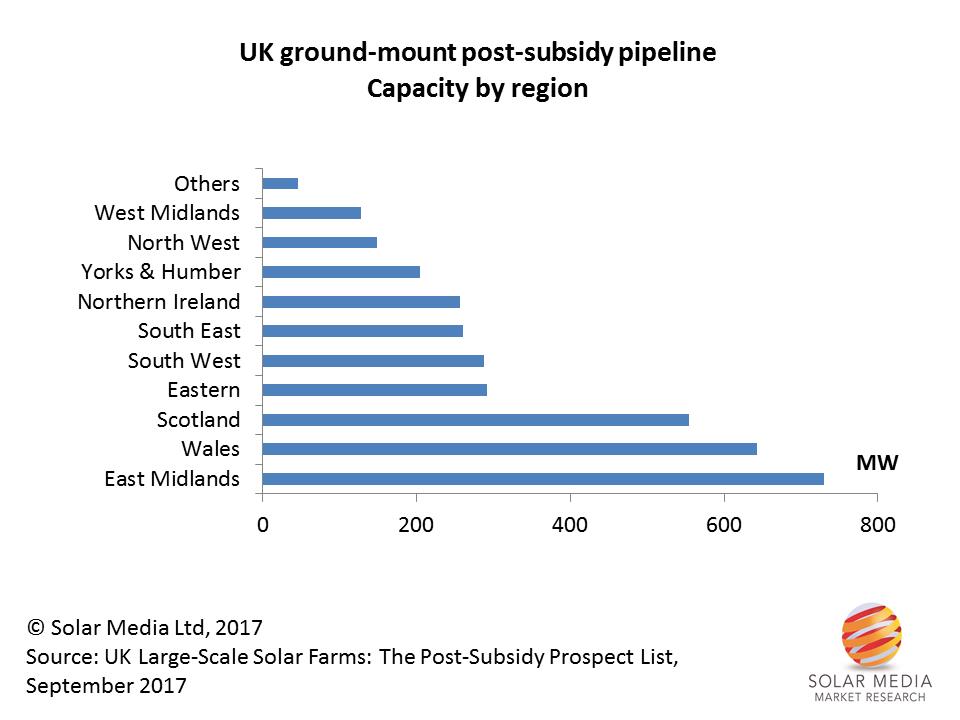
Most of the solar sites in the pipeline are located in the East Midlands area of England, Wales, and Scotland.
The site location analysis is shown below. Most of the capacity remains sited on agricultural land (typically grade 3), with disused airfields and former landfills making up the two other key segments. The potential of landfill sites has been successfully exploited in the UK over the past few years, and remains a key priority for councils and waste management services nationally.
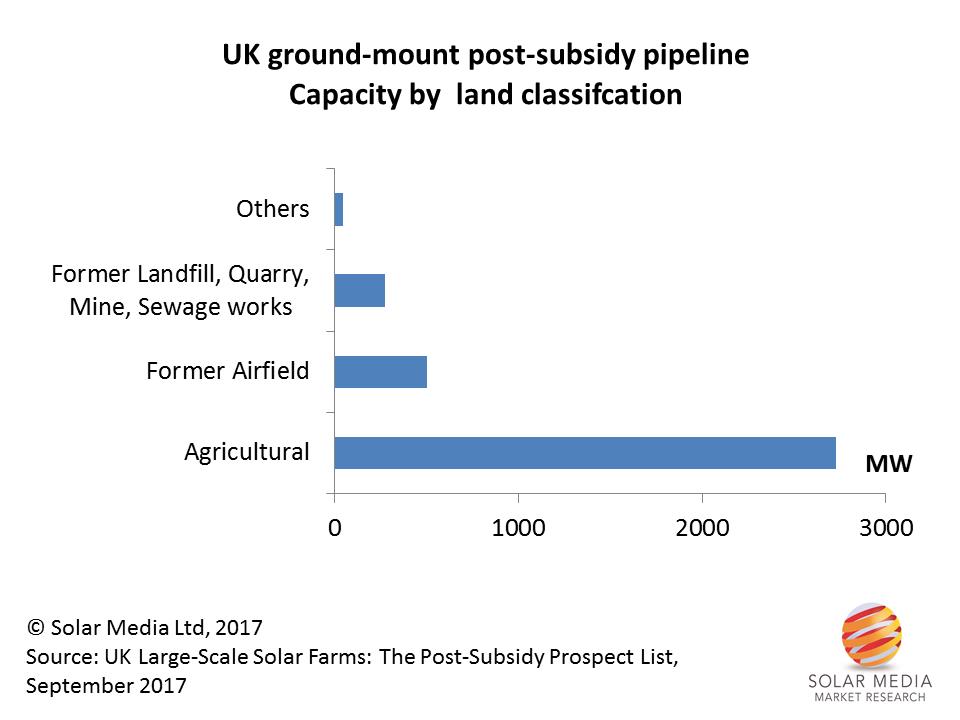
Siting of solar farms is still mainly on agricultural land, with the industry benefitting from limited public concerns that have often been reported in mainstream press outlets in the past.
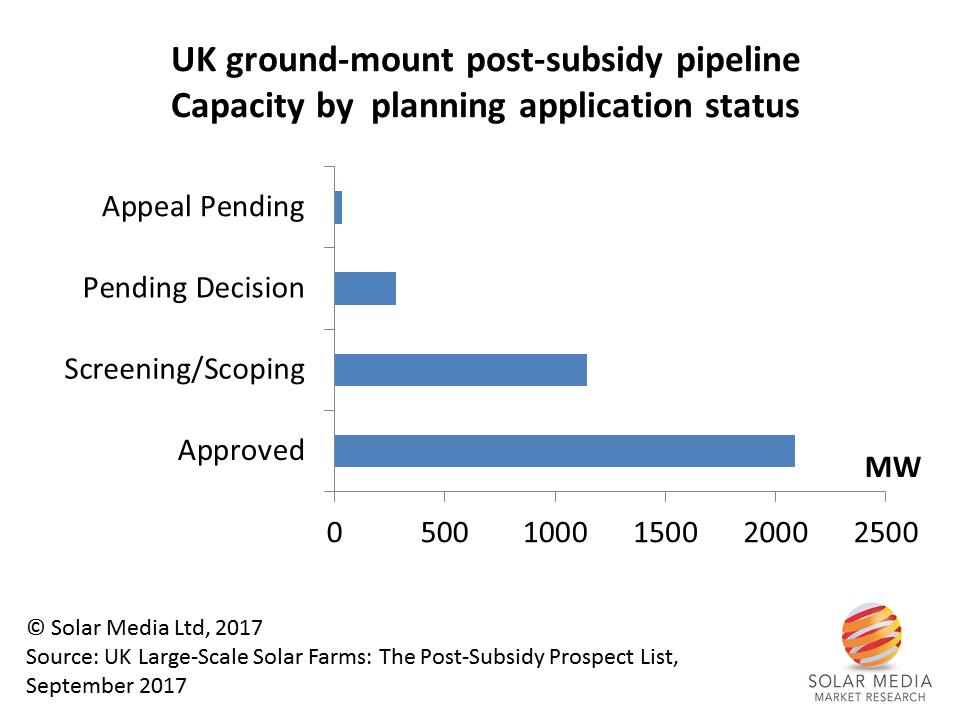
A key question we get asked regularly regarding the pipeline of solar farms relates to the status of the planning application process. A summary of the pipeline data in this regard is shown in the graphic below.
The issue is of course critical, with full planning approval, and subsequent conditional discharges being implemented, prior to any site completion in the UK. This is nothing new, but places one of several key requirements for all the sites in the pipeline. (Other key issues include a grid-connection offer where necessary, raising infrastructure finance, and having viable external revenue streams post-build.)
In fact, the vast majority of sites already have planning approval, in part due to the number of sites that have spilled over from legacy FiT/RO planning applications. Many of the unbuilt partial (or surplus) RO-based sites in the database have already got grid-connection to accommodate site completion to original RO intended red-line capacities before the 5MW limit was imposed.
Of the applications that have gone in to planning since July 2015 (effectively marking the subsidy-free transition point from a planning perspective), the success rate of applications has been very good. This can largely be attributed to there being a smaller number of (more long-term driven) developers that understand the need for site-selection from the start, thereby greatly simplifying the screening and public consultation phases ahead of LPA decision-making.
The other main takeaway from the graphic below is the large number of sites making up the Screening/Scoping segment. This includes sites being proposed from a wide variety of stakeholders, including local councils, established solar project developers, and others such as water utilities.
It should be noted also that some of the plans being scoped for very large sites (including a 300MW site being considered in the south of England) are not included within our pipeline, owing to lack of details yet hitting the relevant LPAs.
Most of the pipeline sites for large-scale solar farms have planning approval, but are awaiting other factors to be concluded before any possible build-out, including grid-offer and importantly a viable return-on-investment to justify build-out.
In releasing the new report, we have established a new methodology to help users of the database to fully understand the history and proposed finance mechanisms at the site level. This feeds also into our forecasting tool, discussed in more detail below.
There are two key funding/revenue-stream metrics we track now at the site level. This is more specific to the new post-subsidy environment, and these are shown below in the following two graphics.
The first graphic shows the original revenue-stream/incentive-scheme that was targeted by the original project developers of the sites. We have tagged all the carry-over projects from the former incentive climate with the term ‘Legacy’. This allows easy filtering of projects that were driven purely by former government schemes (FiT, RO, and CfD), and those that are firmly in the post-subsidy regime and are seeking new forms of revenue streams when built.
The other categories include NIROCs (relevant still within the pipeline due to grace-period compliance), and RO Surplus sites (known unused capacity that is being driven by adding energy storage and/or private-wire to existing 1.2ROC accredited sites).
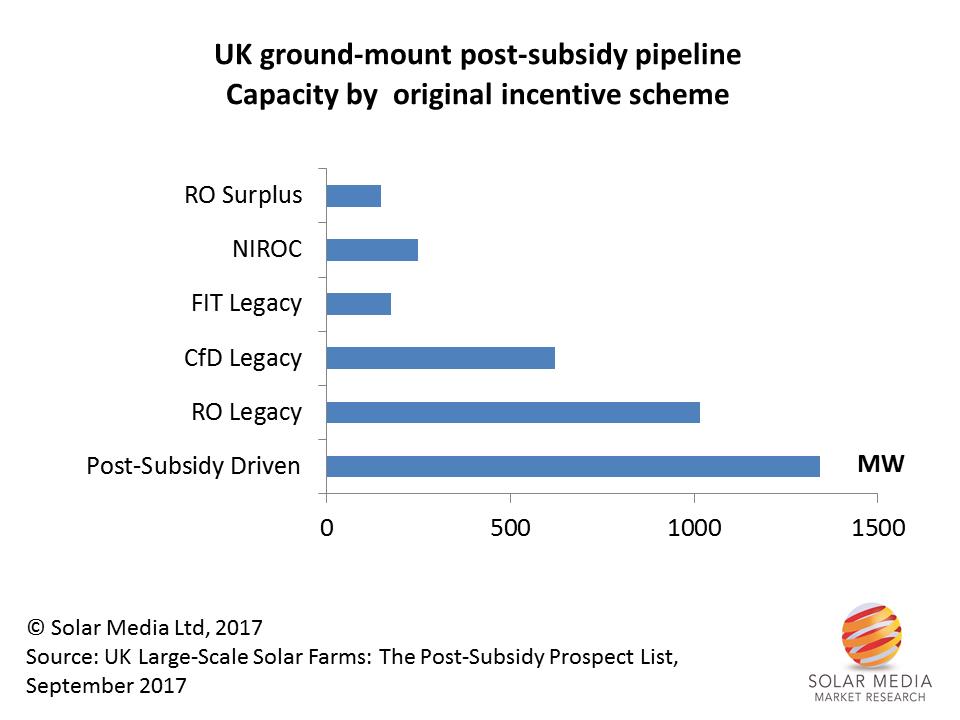
Most of the capacity in the pipeline today is coming from applications or plans that have arisen following government announcements that effectively ended incentive-motivated planning applications.
The second key financial category is by far the most important, and effectively the single most critical issue that will determine how many of the 330-plus sites actually get built.
While the simplistic view of post-subsidy is too often confused with grid-parity claims, the reality is that new built solar farms today require alternative revenue streams, such as having a private-wire in place or co-locating with energy storage systems. Sites built out in 2017 and 2018 are likely to have a range of revenue streams including private wire, PPAs, and energy storage, with a combination of on-site generation and exporting.
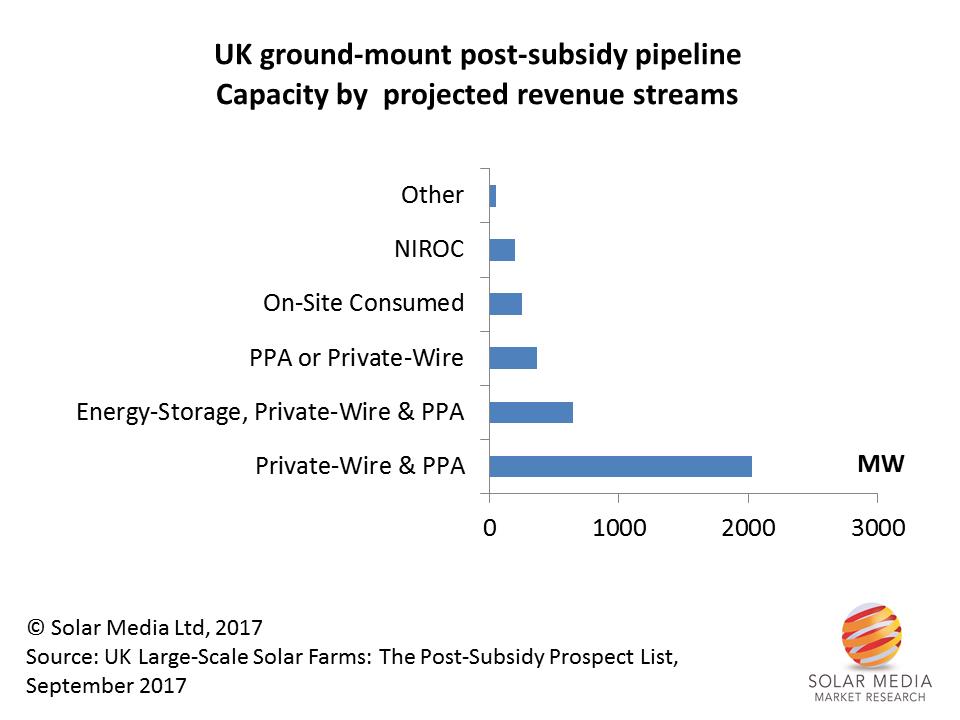
Revenue streams of solar farms built out during 2017-2018 are likely to use a combination of energy-storage based revenues, combined with private-wire and PPA agreements.
Related to the revenue justification of the new solar farms is the co-location issue. The graphic below shows the capacity of the pipeline where there are known plans to co-locate with (typically existing) wind farms or (proposed new) energy storage systems.
Not surprisingly, most of the capacity is based on stand-alone solar farms, but the >700MW of solar capacity where there are plans to add energy storage systems is one of the most encouraging factors increasing the prospects of a post-subsidy rebound being clearly visible during 2018.
It would seem today that the scope for developers to return to approved solar farms and introduce material amendment documentation for ESS inclusion is certainly possible, and as soon as the first built sites in the UK are announced, we could see an uptick in planning activity here.
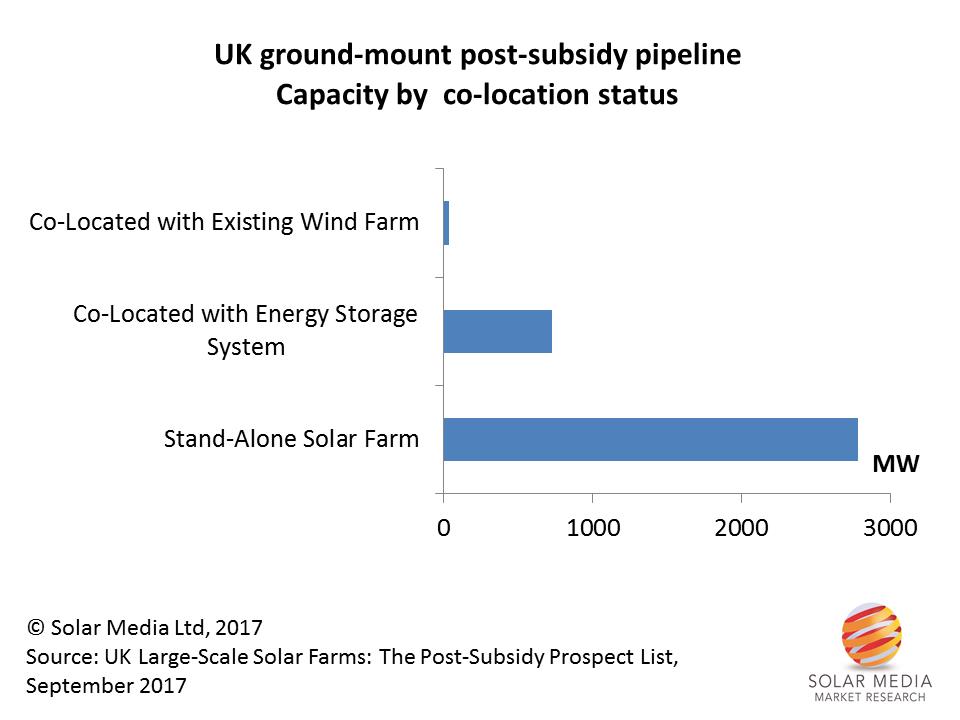
The UK’s leading position as a first-mover in utility-based energy storage deployment is proving to be one of the key drivers for co-locating new solar farms, expanding the range of revenue streams on offer post-build.
Finally, across all the 300-plus sites in our new report, we have included a forecast probability factor. This is based on a host of factors, from planning status, co-location plans, but importantly having frequent discussions with developers, EPCs and component suppliers.
The graphic below shows the consolidated output from the sites, across different build-out probability entries. Sites with probability of completion >50% today are relatively small, as is fully expected based on the industry still being in no-subsidy mode, rather than post-subsidy risk-free positivism.
The spike allocated to 20% reflects the high levels of capacity coming from new plans (pre full application, and typically at site scoping or screening/EIA stages with LPAs), with many of these projects falling into the >30MW site size bracket.
Our in-house research team makes weekly (sometimes daily) forecast adjustments to sites in the report database, with the changes supplied at the end of each month in the new report release.
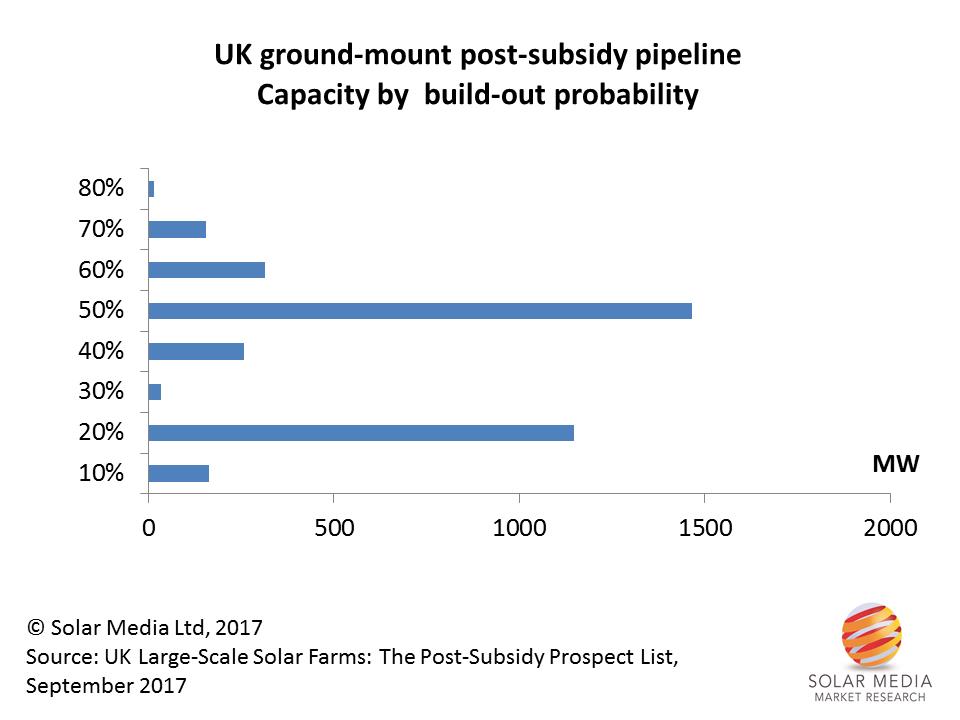
Several hundred megawatts of solar farms in the pipeline are currently estimated to have >50% prospect of build-out in the next 12-18 months, with this number expected to increase once the first few subsidy-free schemes are announced in the UK.
The September release of the new UK Large-Scale Solar Farms: The Post-Subsidy Prospect List report is now available, with full details of the 330-plus sites shown. The list is ideal for component suppliers (modules, inverters, mounting), EPCs and asset-owners/vehicles needing early visibility on prospects and opportunities in the UK for the 2018-2020 period.
The report has daily market updates from our team, is released monthly, and is supplied in flat-file database format for easy data manipulation or exporting to CRM tools.

Credit: Lightsource.