The latest data from the Department for Energy Security and Net Zero (DESNZ) has revealed that both domestic and non-domestic solar installations are continuing to rise in the UK.
As of the end of April 2025, the UK has a total of 18.1GW of solar capacity across 1,780,000 installations; this marks an increase of 5.9% (1GW) since April 2025. In April of this year, 20,405 new solar installations with a combined capacity of 82MW were completed, a figure which DESNZ notes is higher than the average figures seen between 2016 and 2021.
While the vast majority of solar PV installations by volume are domestic, making up 1,537,058 (86%) of the nation’s total solar installations, these installations only make up around 31% of the total MW capacity of UK solar. In April 2025, 68% of new solar PV was installed on a residential building, adding 59MW of capacity.
Last year saw 191,000 solar installations added in the UK, a 3% decrease from 2023’s figure of 197,000. However, this number is far greater than the average number of annual installations between 2016 and 2022, which stands at 63,000 annually.
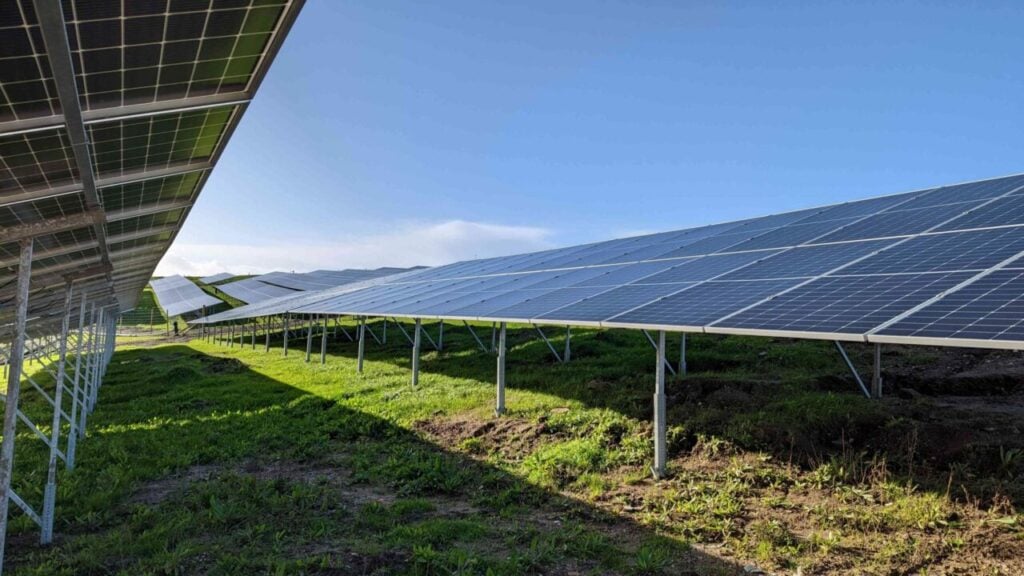
As of the end of March 2025 (Q1 2025), at least 43% of solar capacity (7.71GW) came from ground-mounted or standalone solar installations, including the two operational solar PV power plants under the Contracts for Difference (CfD) scheme, the Charity and Triangle solar PV power plants. Furthermore, DESNZ estimates that roughly half of the solar capacity that is currently categorised as “unaccredited” is made up of ground-mounted solar projects, which brings ground-mounted solar to account for approximately 59% of the UK’s total capacity.
Additionally, according to Solar Media Market Research, the UK is expected to add between 3GW and 3.5GW of new solar capacity in 2025. Around 20% of the 2.3GW of solar deployed across 2024 came from residential rooftop installations, with commercial rooftop installations contributing another 20%.
However, recent analysis indicates that there are a number of factors that could hinder expanding solar capacity in the UK this year; most notable of these is the increasing time taken for planning applications to be approved.
Solar Media Market Research analyst Josh Cornes notes that between 2010 and 2015, the average time for a project to get approval sat at around 29 weeks; in the past five years, the average wait time for approval has increased to 45 weeks, with the current longest time for a project to go through the Local Planning Authority approval process standing at 177 weeks.