Ever since large-scale solar hit the UK, the Department of Energy and Climate Change (DECC) has struggled with keeping track of cumulative solar PV capacity deployed in the UK. And this is directly transferrable to any third-party organisation that uses government data as the gospel for actual solar capacity in the UK.
Let’s explain what the reasons are and how they manifest themselves.
First – the reason. This is easy to explain. It is due to the speed at which solar farms can be added to the grid; kudos to the solar industry and the developers and EPCs for their efficiency. The current methods – by which capacity added shows up on accreditation registers, gets transferred to Ofgem and finally used by DECC – is simply not capable of managing this. It was simply not set up to address solar, and still relies on non-industry personnel all along the chain. A good analogy is imagining putting a bullet train on a railway track installed by Victorians for the first steam engines. Simply put, the train is not going to get to 200mph.
The problems show up when a lot of solar capacity is added quickly – cue the Q1 tracking dilemma imposed by RO fiscal years, and it goes a long way to explaining the problems DECC has had in tracking solar PV deployment in the UK during 2014 and 2015.
Let’s look at the numbers to illustrate this. The first big solar deployment in the UK was during Q1’14 in the run up to the 1.6 RO closure on 31 March 2014. By the middle of April 2014, shrewd voices within the UK’s solar industry put the installed capacity during the quarter at above 1GW. In fact, the final figure was closer to 1.1GW. Now – let’s look, by way of a graph, at what DECC was saying for cumulative solar PV capacity installed purely in Q1’14 after March 2014.
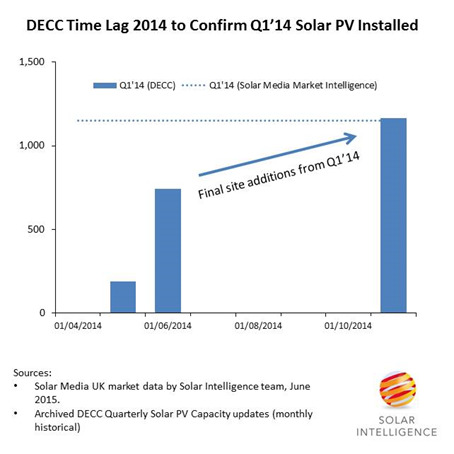
Figure 1: While Q1’14 solar PV deployment in the UK was 1.1GW, it took DECC about 7 months to finally get all the Q1 capacity showing up on the monthly solar PV deployment releases. Source: Solar Media and archived DECC releases.
The graph above shows that it took DECC over half a year to finally count the strong solar PV capacity deployed in Q1’14. In fact, the 29 May 2014 release from DECC had only 189MW shown as installed in Q1’14 (rather embarrassingly giving some companies more than 100% market share!). This shot up to 743MW in the 26 June 2014 release. By October, it was finally at the 1.1GW level.
Now let’s fast forward to 2015. Earlier this week, the Solar Intelligence team finished its in-house research and surveys on what happened in Q1’15. With over 190 large-scale solar farms identified as completed in Q1’15 by the team, we placed Q1’15 new solar PV capacity additions at 2.53GW. So, how does this compare with DECC’s monthly releases so far?
We have just done the same graphic as above, but for Q1’15, using this week’s release from DECC on quarterly solar PV capacity in the UK.
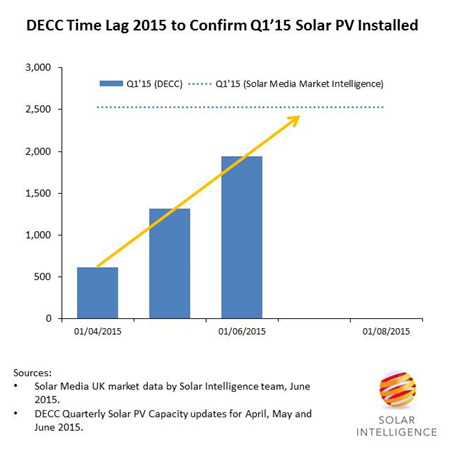
Figure 2: Tracking DECC’s gradual confirmation of the 2GW+ added in the UK during Q1’15. Source: Solar Media and archived DECC releases.
From the above graphic, the release from DECC at 30 April 2015 claimed that the UK added 614MW in Q1’15. One month later, on 31 May 2015, the estimate for Q1’15 had gone up to 1.315GW. And just this week (if you read the release correctly), it claimed that Q1’15 solar PV additions were 1.944GW. So the trend is upwards, and Solar Media fully expects it to take about 2-3 months more before the Q1’15 figure from DECC is agreeing with Solar Media’s bottom up figure of 2.53GW, based on our own in-house research.
But it is not just the time lag, DECC appears to do itself no favours even when it has the data on hand. Let’s look at the latest release from DECC.
DECC claims: “'Latest quarter (based on 'Quarter' worksheet)… Overall solar PV capacity at the end of 2015 Q1 stood at 6,521 MW, an increase of 25 per cent (1,285 MW) on that at the end of 2014 Q4.”
It is not clear why DECC’s quarterly data has no bearing on its monthly data, in the same file download. Let’s look at the monthly figures that are, as they suggest, updated monthly!
Here is what the monthly data showed on DECC’s download yesterday.
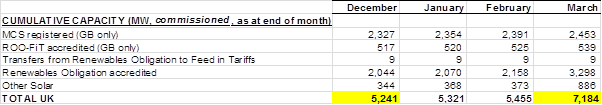
Figure 3: DECC’s monthly solar PV capacity figures, released 25-6-15.
And so it is, from above, in black-and-white, DECC has now reached 1.944GW for solar PV capacity added during Q1’15. (Subtract the two numbers highlighted by us in yellow above.)
Of course, what we have failed to mention is that December numbers are still going up, and most of the sites being added on the government figures don’t necessarily show the actual solar PV capacity added. Right now, RAF Lyneham for example is not showing on the REPD databases as completed, and even if it was, it would probably show up as 40MW (the original application figure) and not the 69.5MW that was installed, with no small help from the Cabinet Office, unless some of the Ofgem sub-contracted statisticians are cunningly reading Solar Power Portal!
So, chances are that in 2-3 months, the same calculation above will be showing Q1’15 additions at around 2.3-2.5GW, with annual deployment estimated at around 7.6GW as of 31 March 2015. If this happens, then at least it will be a sign that the system is working to some extent, and will be good to 90-95% of the real figure.
Unless something is changed in the way solar PV capacity is shown by DECC, then it is certain that this whole episode will only repeat in Q1’16. In fact, it could even be worse owing to a greater number of smaller-sized solar PV farms being built at the 5MW level.
The Solar Media team has just set up new research methodology to enable it to keep in touch with solar PV capacity added, almost in real time. Our goal is to take no more than 30 days to size the market at the end of any given month, and this includes the March rushes. We will be discussing the findings from this new methodology on a monthly basis on Solar Power Portal, as part of our UK market reports being issued to help the industry understand exactly what is happening with solar PV installed today in the UK.